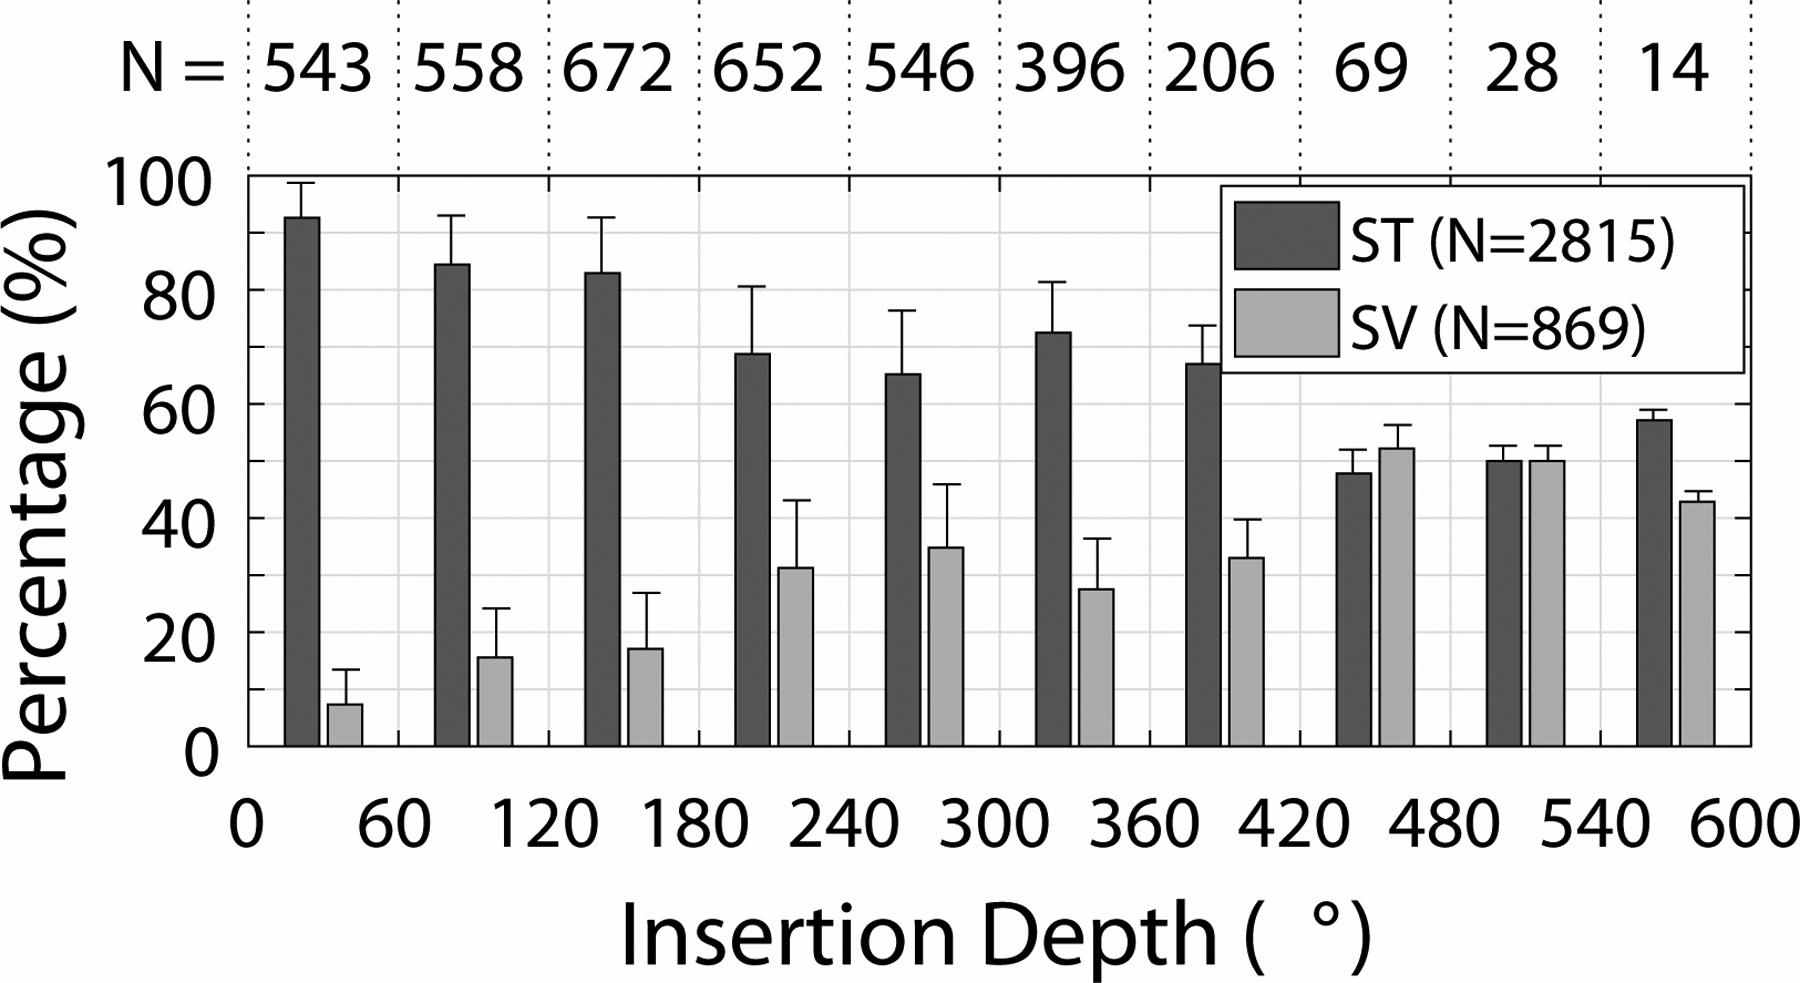
Figure 3:

Histogram of individual electrodes located in Scala Tympani (ST) and Scala Vestibuli (SV) as a function of insertion depth in degrees, illustrated in terms of the percentage of electrodes in each scala for a given insertion depth range. The numbers (N) at the top of the plot show the number of electrodes at each depth, and the numbers inside the legend indicate the total number of electrodes in each category. Error bars show +1 standard deviation.
