
Figure 4:
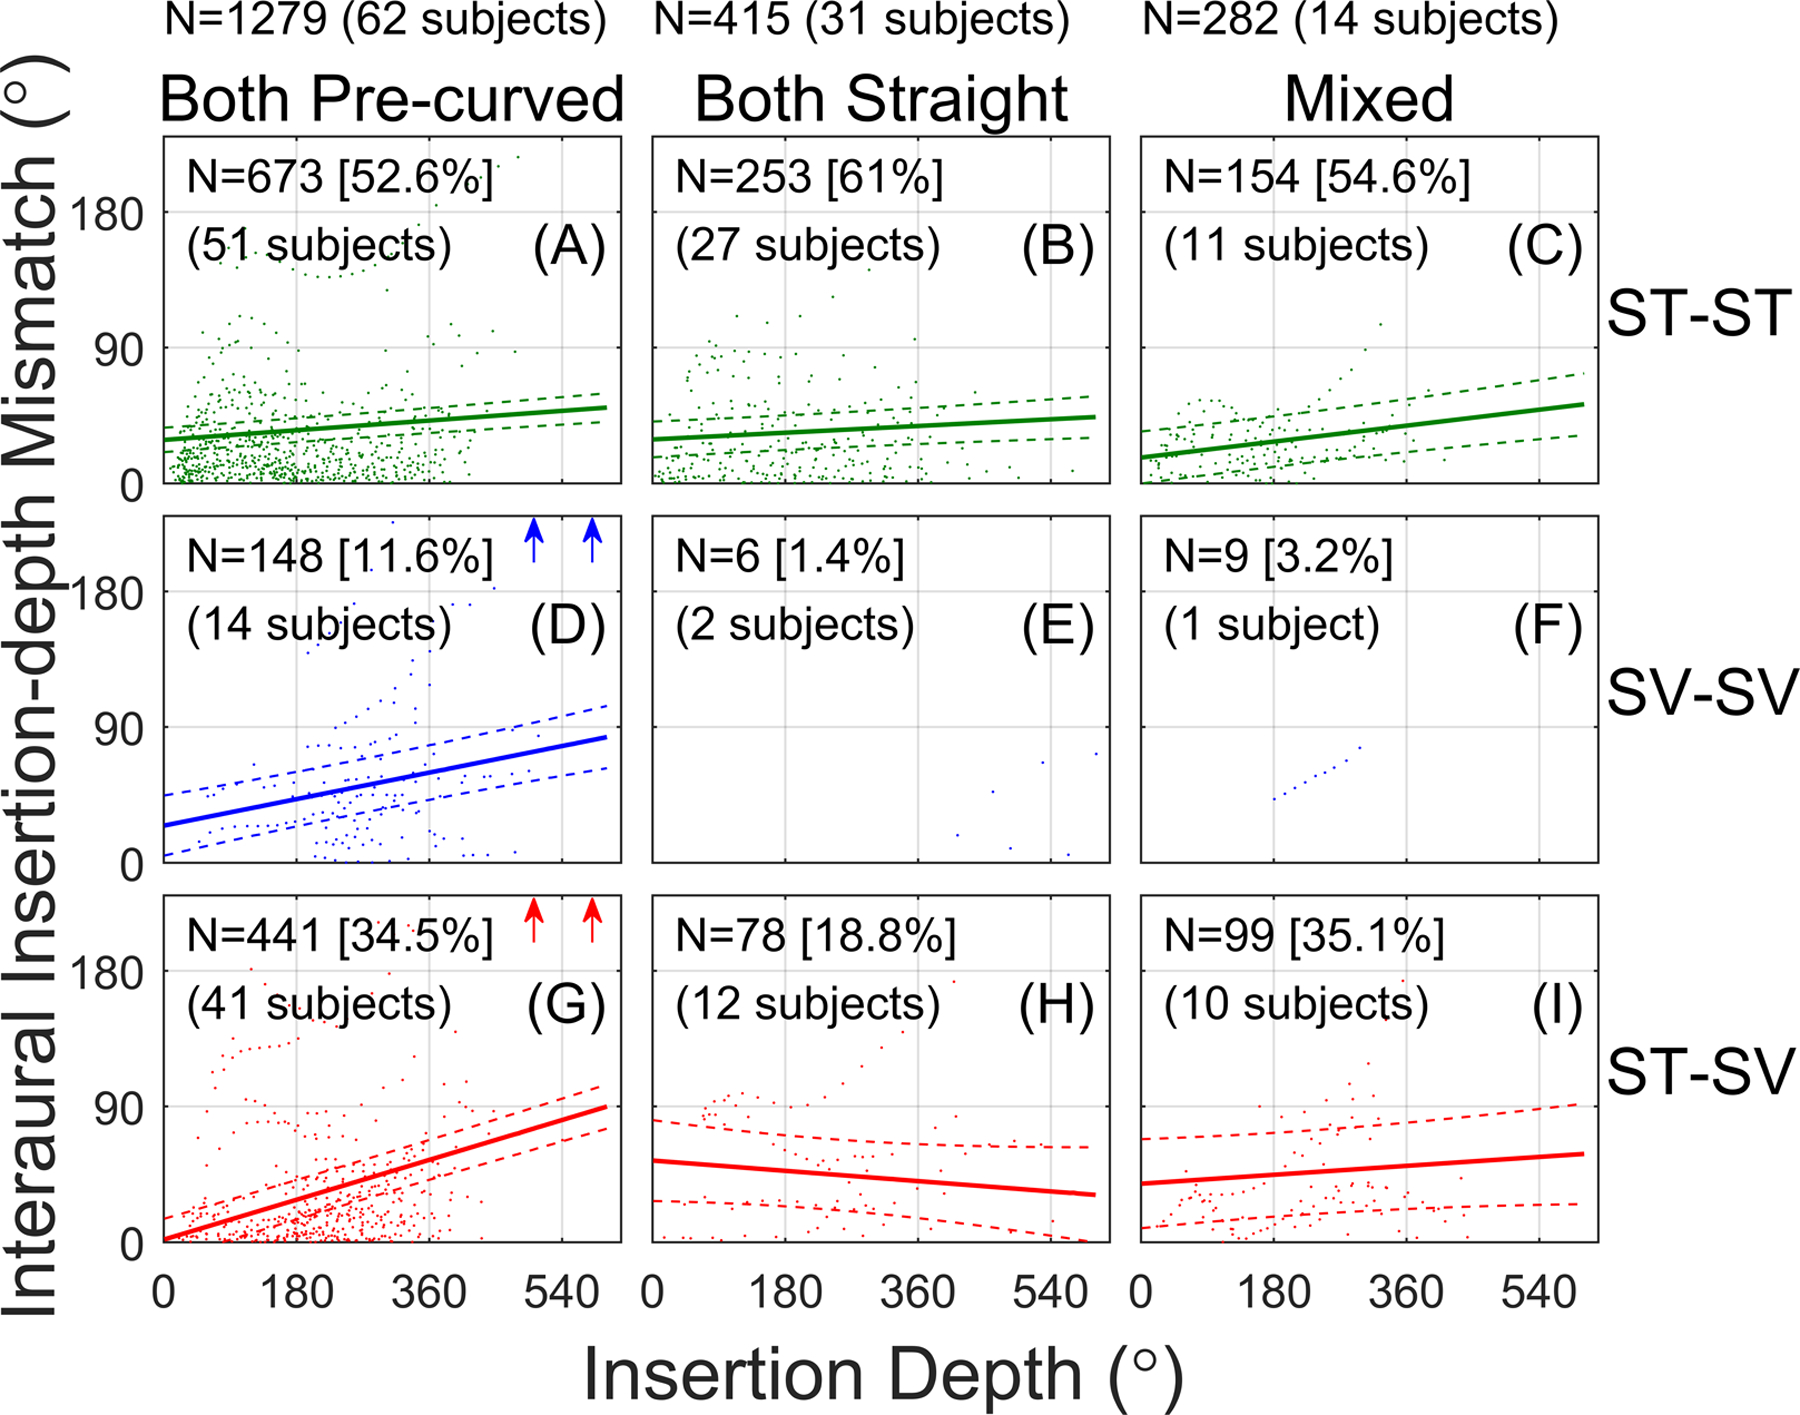
Interaural insertion-depth mismatch as a function of the average insertion depth for a given electrode pair. Each panel represents a different combination of scalar location (rows) and array type (columns). Solid lines show linear fits to the data from the linear mixed effects model. Dashed lines show the 95% confidence interval of the fits. The number of electrode pairs (the data points) and the number of subjects contributing to each condition are reported in each panel. Arrows indicate cases with >240° interaural insertion-depth mismatch that fell outside the plot range to better show the fits.