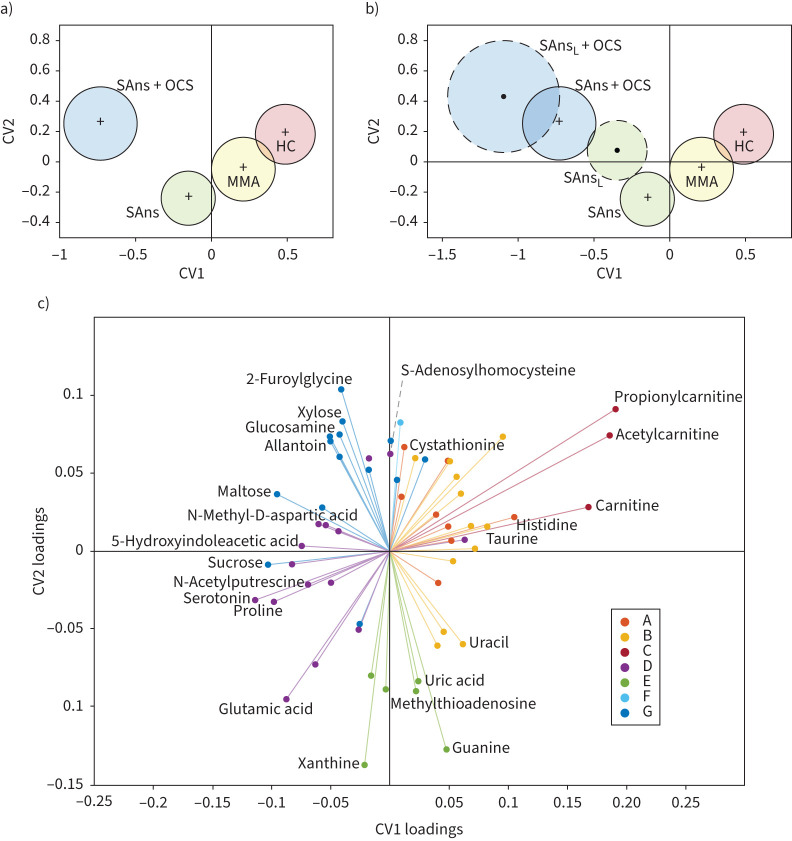
FIGURE 2.
Principal components–canonical variate analysis (PC-CVA) with non-smoking patients with severe asthma stratified by oral corticosteroid (OCS) use. Cross validation showed that five principal components were the optimal number to use in the CVA model (supplementary figure E2). a) Scores plot of baseline data, labelled by clinical class and b) longitudinal data for severe asthma groups projected into the baseline model. Red: healthy controls (HC); yellow: mild-to-moderate asthma (MMA); green: severe asthma non-smokers (SAns); blue: severe asthma non-smokers taking OCS treatment (SAns+OCS); L: longitudinal data; black cross: mean of each baseline group; black dot: mean of each longitudinal group; solid circles: 95% CI of the mean of baseline groups; dashed circles: 95% CI of the mean of longitudinal groups. c) Loadings plot displaying metabolites that significantly (p<0.05) contributed to the model. Metabolite position displays the magnitude and direction of effect in canonical variate (CV) 1 (x-axis) and CV2 (y-axis). The quadrant positions of metabolites are related to those of the clinical groups in the scores plots. In other words, metabolites are most abundant in the clinical groups with which they share a quadrant. Metabolites are colour-coded based on the corresponding cluster as identified in figure 1 and according to the figure legend.

