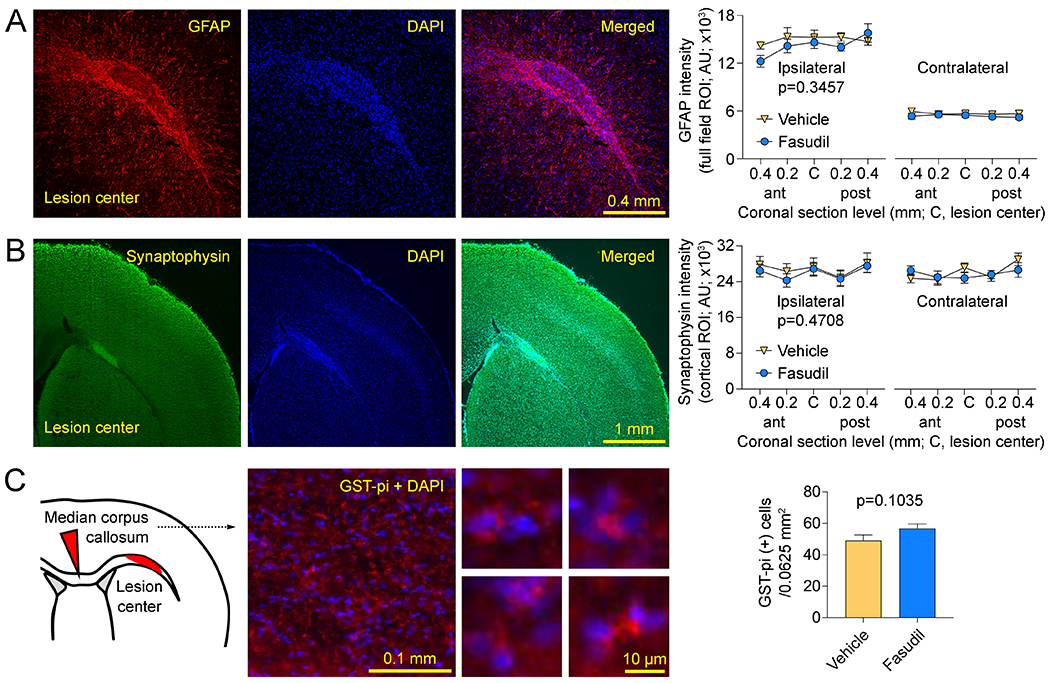
Figure 5: Immunohistochemical examination.

(A) Left: Representative sections show perilesional reactive astrocytosis (GFAP), nuclear stain DAPI and the merged image obtained at the coronal section in the center of the lesion along the anteroposterior axis. Right: GFAP intensity was quantified in the entire field of view positioned as shown, at 5 coronal section levels at 200 μm intervals centered along the anteroposterior axis of the lesion bilaterally (two-way ANOVA for repeated measures). (B) Left: Representative sections show synaptophysin, nuclear stain DAPI and the merged image obtained at the coronal section in the center of the lesion along the anteroposterior axis. The bright synaptophysin signal in the lesion represented autofluorescence and was excluded from the cortical region of interest. Right: Synaptophysin intensity was quantified in a region of interest outlining the entire cortex within the field of view positioned as shown, at 5 coronal section levels at 200 μm intervals centered along the anteroposterior axis of the lesion bilaterally (two-way ANOVA for repeated measures). (C) Left: Representative sections show merged images of mature oligodendrocytes (GST-pi) and nuclear stain DAPI from the median corpus callosum as shown in the inset. Higher magnification images show examples of GST-pi positive cells. Right: GST-pi positive cells were manually counted in the entire field positioned in the center of the median corpus callosum as shown in the inset (0.0625 mm2) and centered along the anteroposterior axis of the lesion. All images were acquired using identical optical settings for a given marker and analyzed in a blinded fashion. P-values indicate vehicle vs. fasudil.
