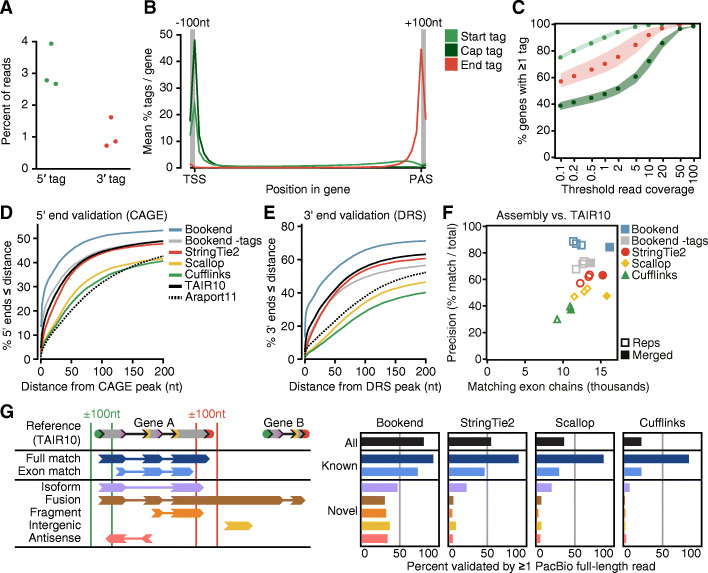
Fig. 2.
End-labeled Smart-seq2 reads accurately detect transcript 5′ and 3′ ends. A Percent of reads in three Smart-seq2 libraries that contained a 5′-labeled or 3′-labeled junction, respectively. B Average signal strength per gene of Start, End, and Cap Tags along gene bodies in 50 bins with an additional 100 nt flanking each gene boundary. Start Tag, any 5′ label; Cap Tag, 5′ label with upstream untemplated G (uuG); End Tag, 3′ label. C Likelihood of a gene to possess ≥1 Start, Cap, or End Tag as a function of aligned read coverage (average read depth/base). D Cumulative frequency of annotated 5′ ends as a function of distance from the closest CAGE peak [36]. E Distance of 3′ ends from the nearest DRS peak [30] as in (D). F Performance of three transcript assemblers, measured by total number of reference-matching exon chains (x-axis) vs. percent of assembled transcripts that match the reference (y-axis). G (Left) Schematic depicting classifications of assembled transcripts against the closest TAIR10 reference isoform. (Right) Rate of validation by PacBio full-length non-chimeric (FLNC) reads for different assemblies, grouped by classification

