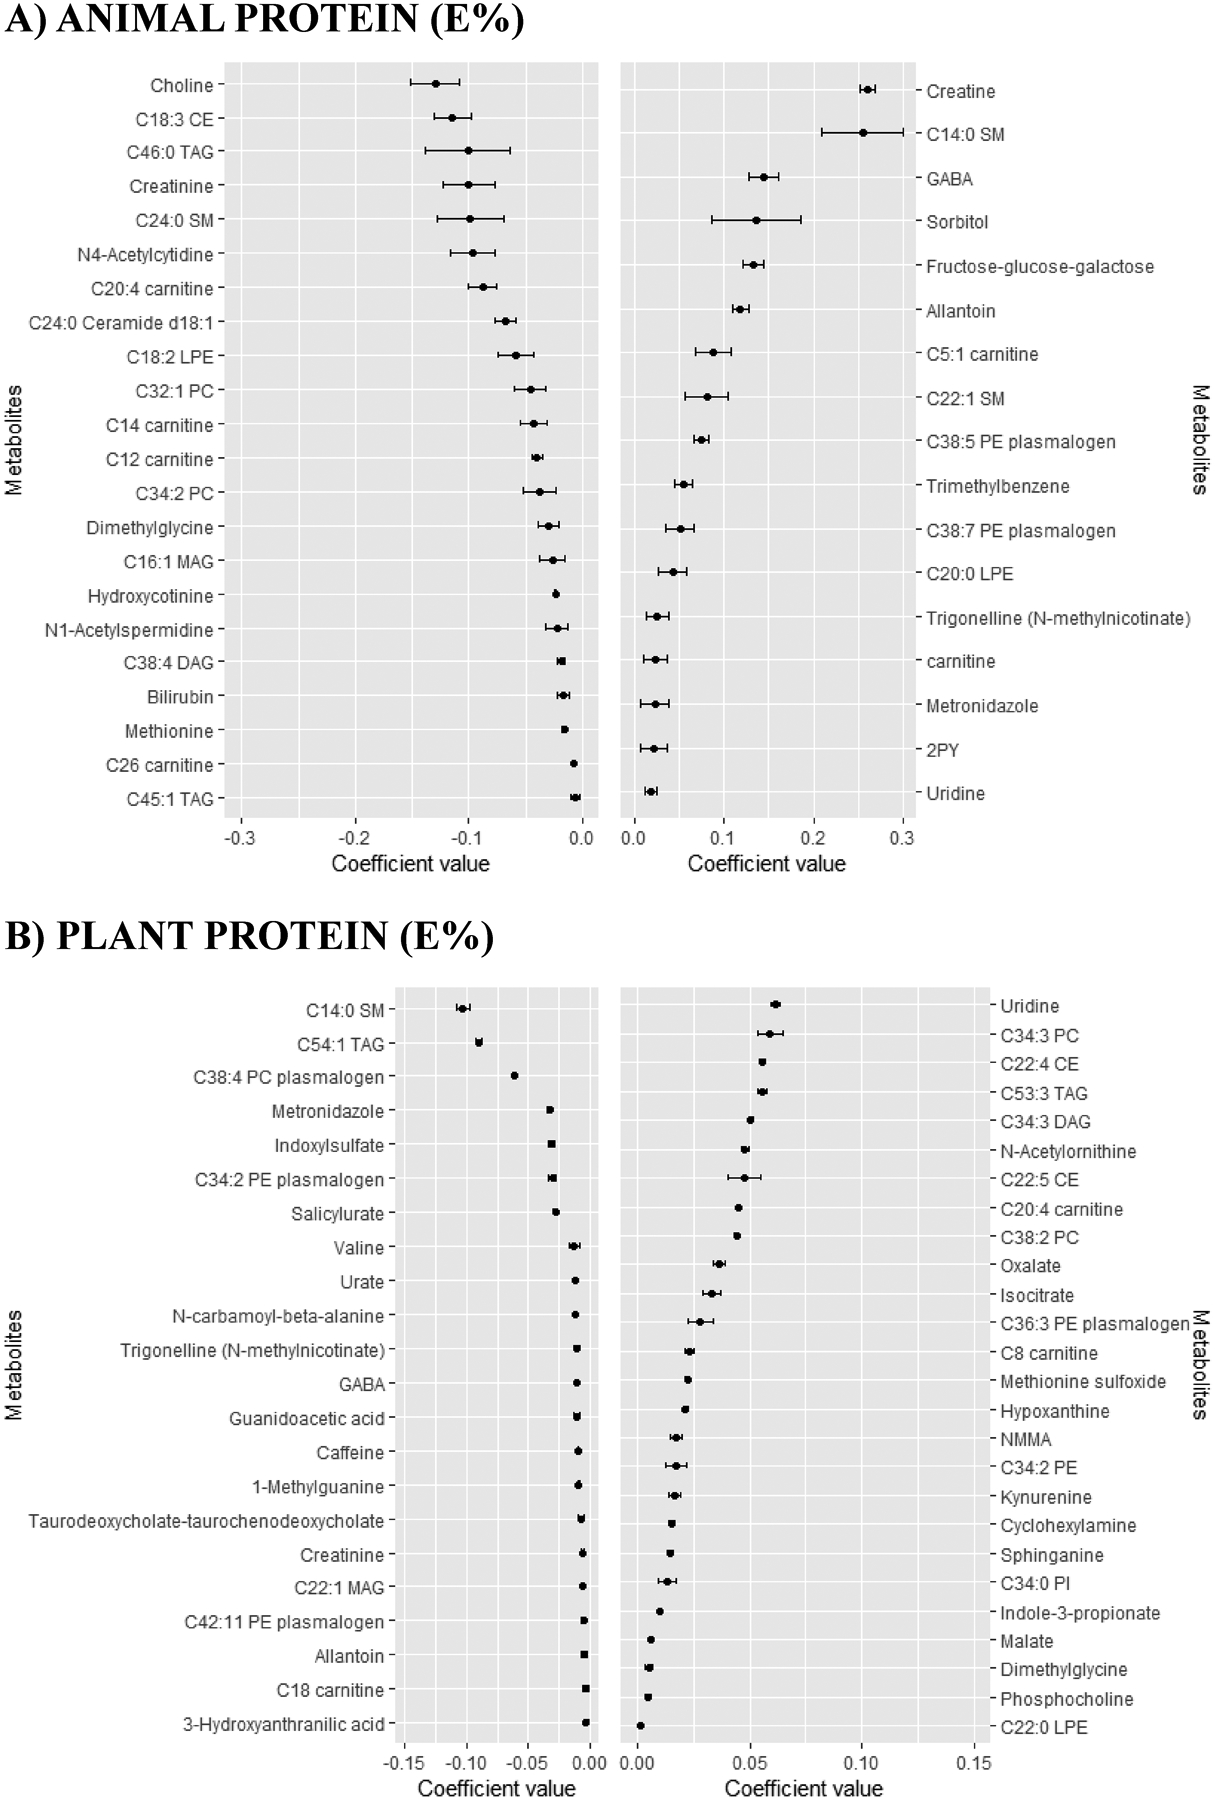
Figure 3.

Coefficients (mean and SD) for the metabolites selected 9–10 times in the 10-CV of the continuous elastic regression for animal protein and plant protein.
Mean and SD of the set of the metabolites selected 9–10 times in the ten times iterated 10-fold-CV of the elastic continuous regression procedure (using lambda.min) employing the whole dataset of subjects (n=1,833). Metabolites with negative coefficients are plotted in the left part, whereas those with positive coefficients are shown in the right part. Abbreviations: 2PY, N-methyl-2-pyridone-5-carboxamide; CE, cholesteryl ester; CV, cross-validation; DAG, diacylglycerol; E%, energy percentage; GABA, gamma-aminobutyric acid; LPE, lysophosphatidylethanolamine; MAG, monoacylglycerol; NMMA, N-methylmalonamic acid; PC, phosphatidylcholine; PE, phosphatidylethanolamine; PI, phosphatidylinositol; SM, sphyngomyeline; TAG, triglyceride.
