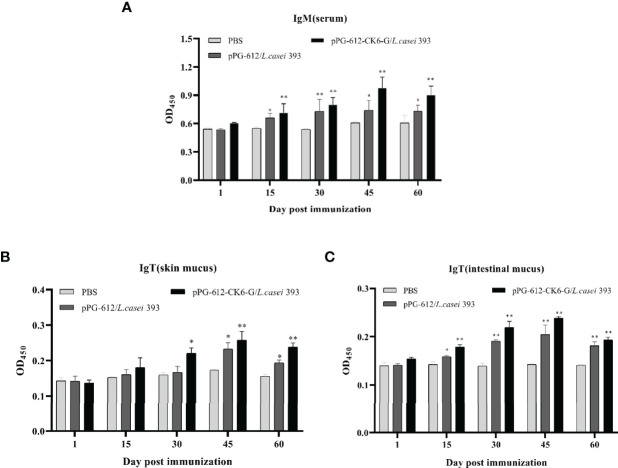
Figure 3.
Levels of specific antibody expression in different tissues 60 days after secondary immunization. (A) Changes in IgM levels in serum at different time periods; (B) changes in IgT levels in skin mucosa at different time periods; (C) changes in IgT levels in intestinal mucosa at different time periods. Data are presented as mean ± SD and P values were calculated using one-way ANOVA and LSD post hoc tests. * represents p<0.05, ** represents p<0.01.

