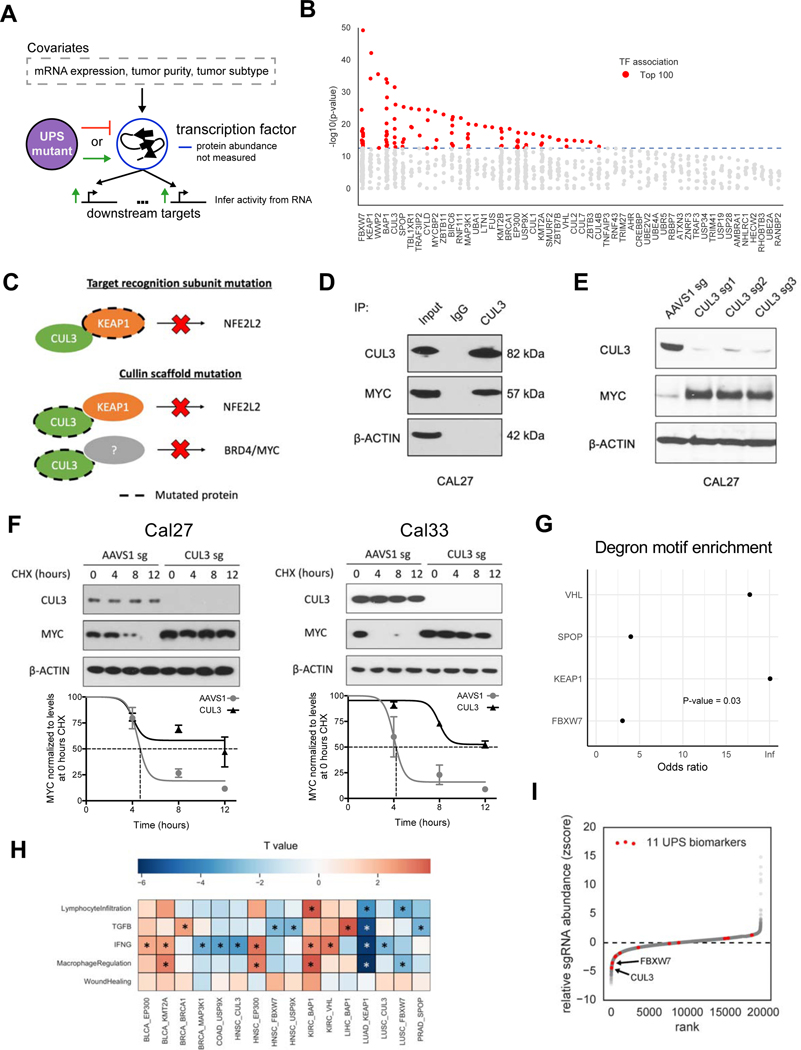
Figure 6. UPS-substrate inference finds association with markers of tumor immune microenvironment.
(A) Diagram depicting the strategy for associating UPS genes with putative transcription factor substrates.
(B) Scatterplot showing the significance of each transcription factor (TF) association for a particular UPS genes (x-axis).
(C) Diagram of inferred substrate relationships of KEAP1 and CUL3.
(D) Western blot showing the co-immunoprecipitation of CUL3 with c-Myc.
(E) Western blot showing increased c-Myc protein abundance in CUL3 KO cells.
(F) Quantification of c-Myc protein half-life upon CUL3 KO in Cal27 and Cal33 cells. Cycloheximide (CHX), a protein translation inhibitor, was given at a concentration of 100 μg/ml. Errorbar = +/− 1 SEM.
(G) Enrichment analysis for degron motifs in associated TF’s for 4 E3 ubiquitin ligases that have a previously reported degron motif (Fisher’s exact test).
(H) Heatmap displaying the association (t statistic) of mutations in UPS driver genes with 5 immune-related biomarkers * = FDR<0.1.
(I) Z-score measuring the relative abundance of cancer cells with a gene knockout when they are co-cultured with T cells, where negative values indicate sensitivity to T cell killing.

