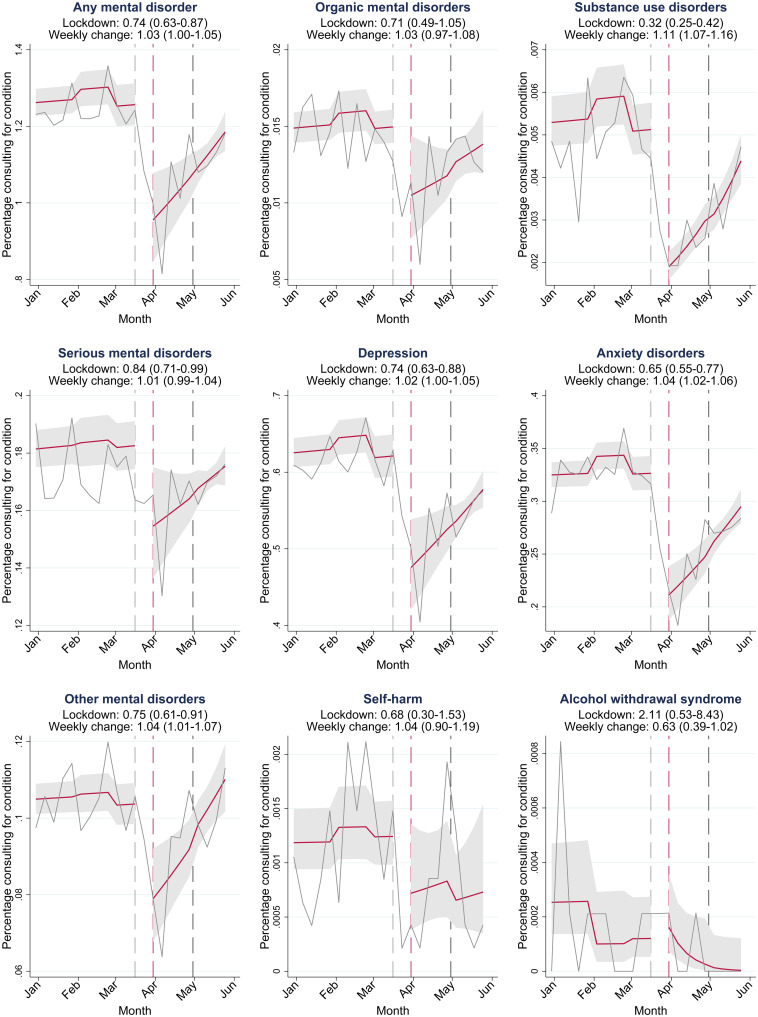
Fig. 2.
Interrupted time-series analysis for changes in outpatient consultations during the lockdown. Solid grey lines represent percentages of the study population consulting outpatient care for the condition in each week between 1 January 2020, and 1 June 2020. Red lines depict the estimated average percentage consulting outpatient care per week with 95% CIs (grey shaded areas). Area between the dashed grey and dashed red line: data not used to account for anticipatory behaviour. Dashed red line: first Monday during lockdown (30 March 2020). Dashed black line: beginning of lockdown level 4 (30 April 2020). Lockdown: odds ratios (OR) for the immediate effect of the lockdown on outpatient consultation rates. Weekly change: OR for the weekly change in the odds of outpatient consultation rates during the lockdown (week 14–22 in 2020). 95% confidence intervals for ORs in parentheses.

