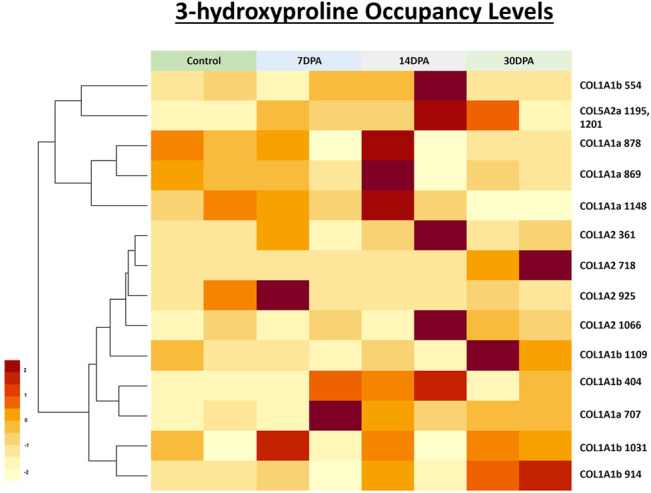
FIGURE 7.

Heatmap depicting the relative occupancy level of 3-hydroxyproline sites in three different chains of collagen 1 deposited in zebrafish heart ECM during regeneration. Further occupancy of one 3-HyP cluster of COL5A2a1195, 1201 was also quantitated during zebrafish heart regeneration. Normalized occupancy values of prolyl-3-hydroxylations were computed to generate the heat map. Light yellow represents the low value (lowest occupancy) and dark red shows the higher value (highest occupancy) in the row.
