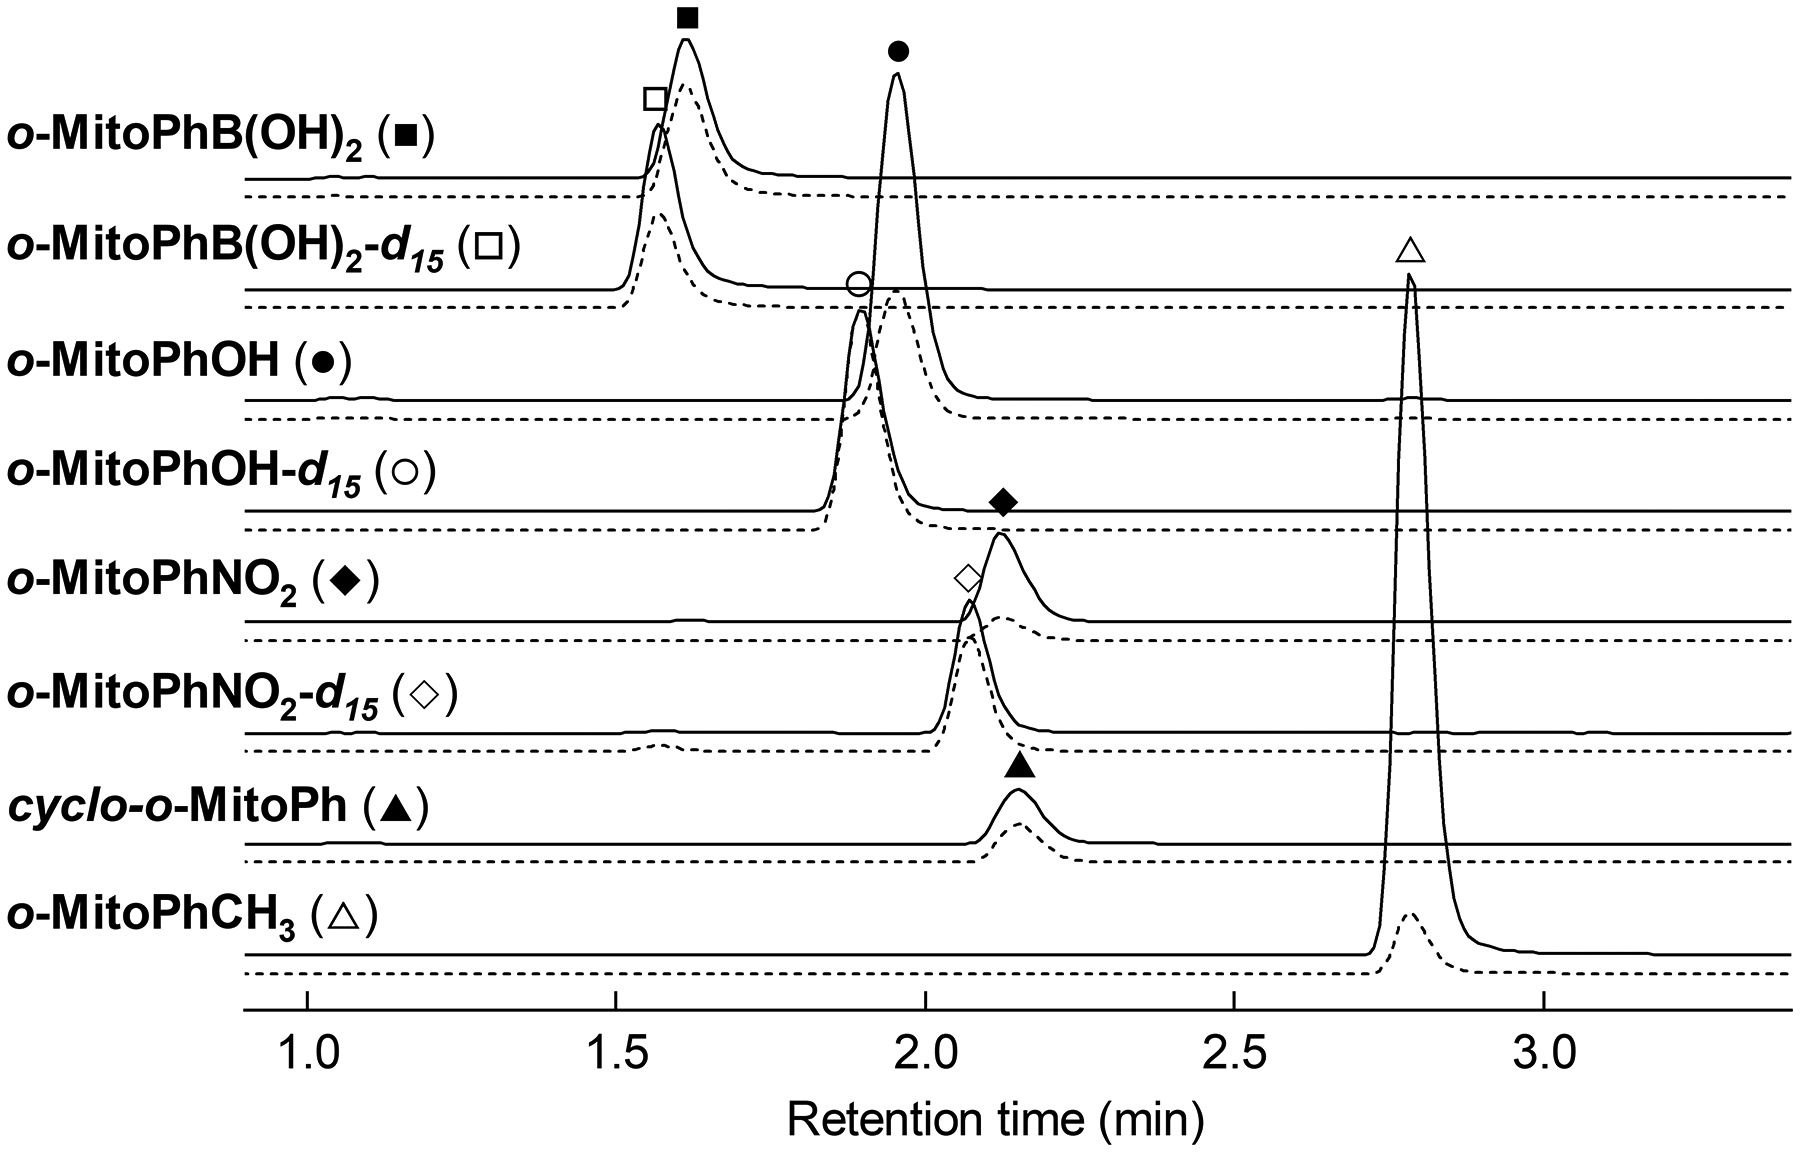
Figure 2. HPLC-MS/MS detection of o-MitoPhB(OH)2, o-MitoPhOH, cyclo-o-MitoPh and o-MitoPhNO2.

The chromatograms have been obtained with the described method by injection of 20 μl of the mixture of o-MitoPhB(OH)2, o-MitoPhOH, cyclo-o-MitoPh and o-MitoPhNO2 (solid symbols) and corresponding internal standards (open symbols) (1 μM each). For each compound two MRM transitions are shown: dominant (solid lines) and reference (dashed lines). HPLC-MS/MS traces were recorded using the parameters shown in Table 2. The traces have not been scaled and thus represent the actual intensities of each MRM transition in the equimolar mixture.
