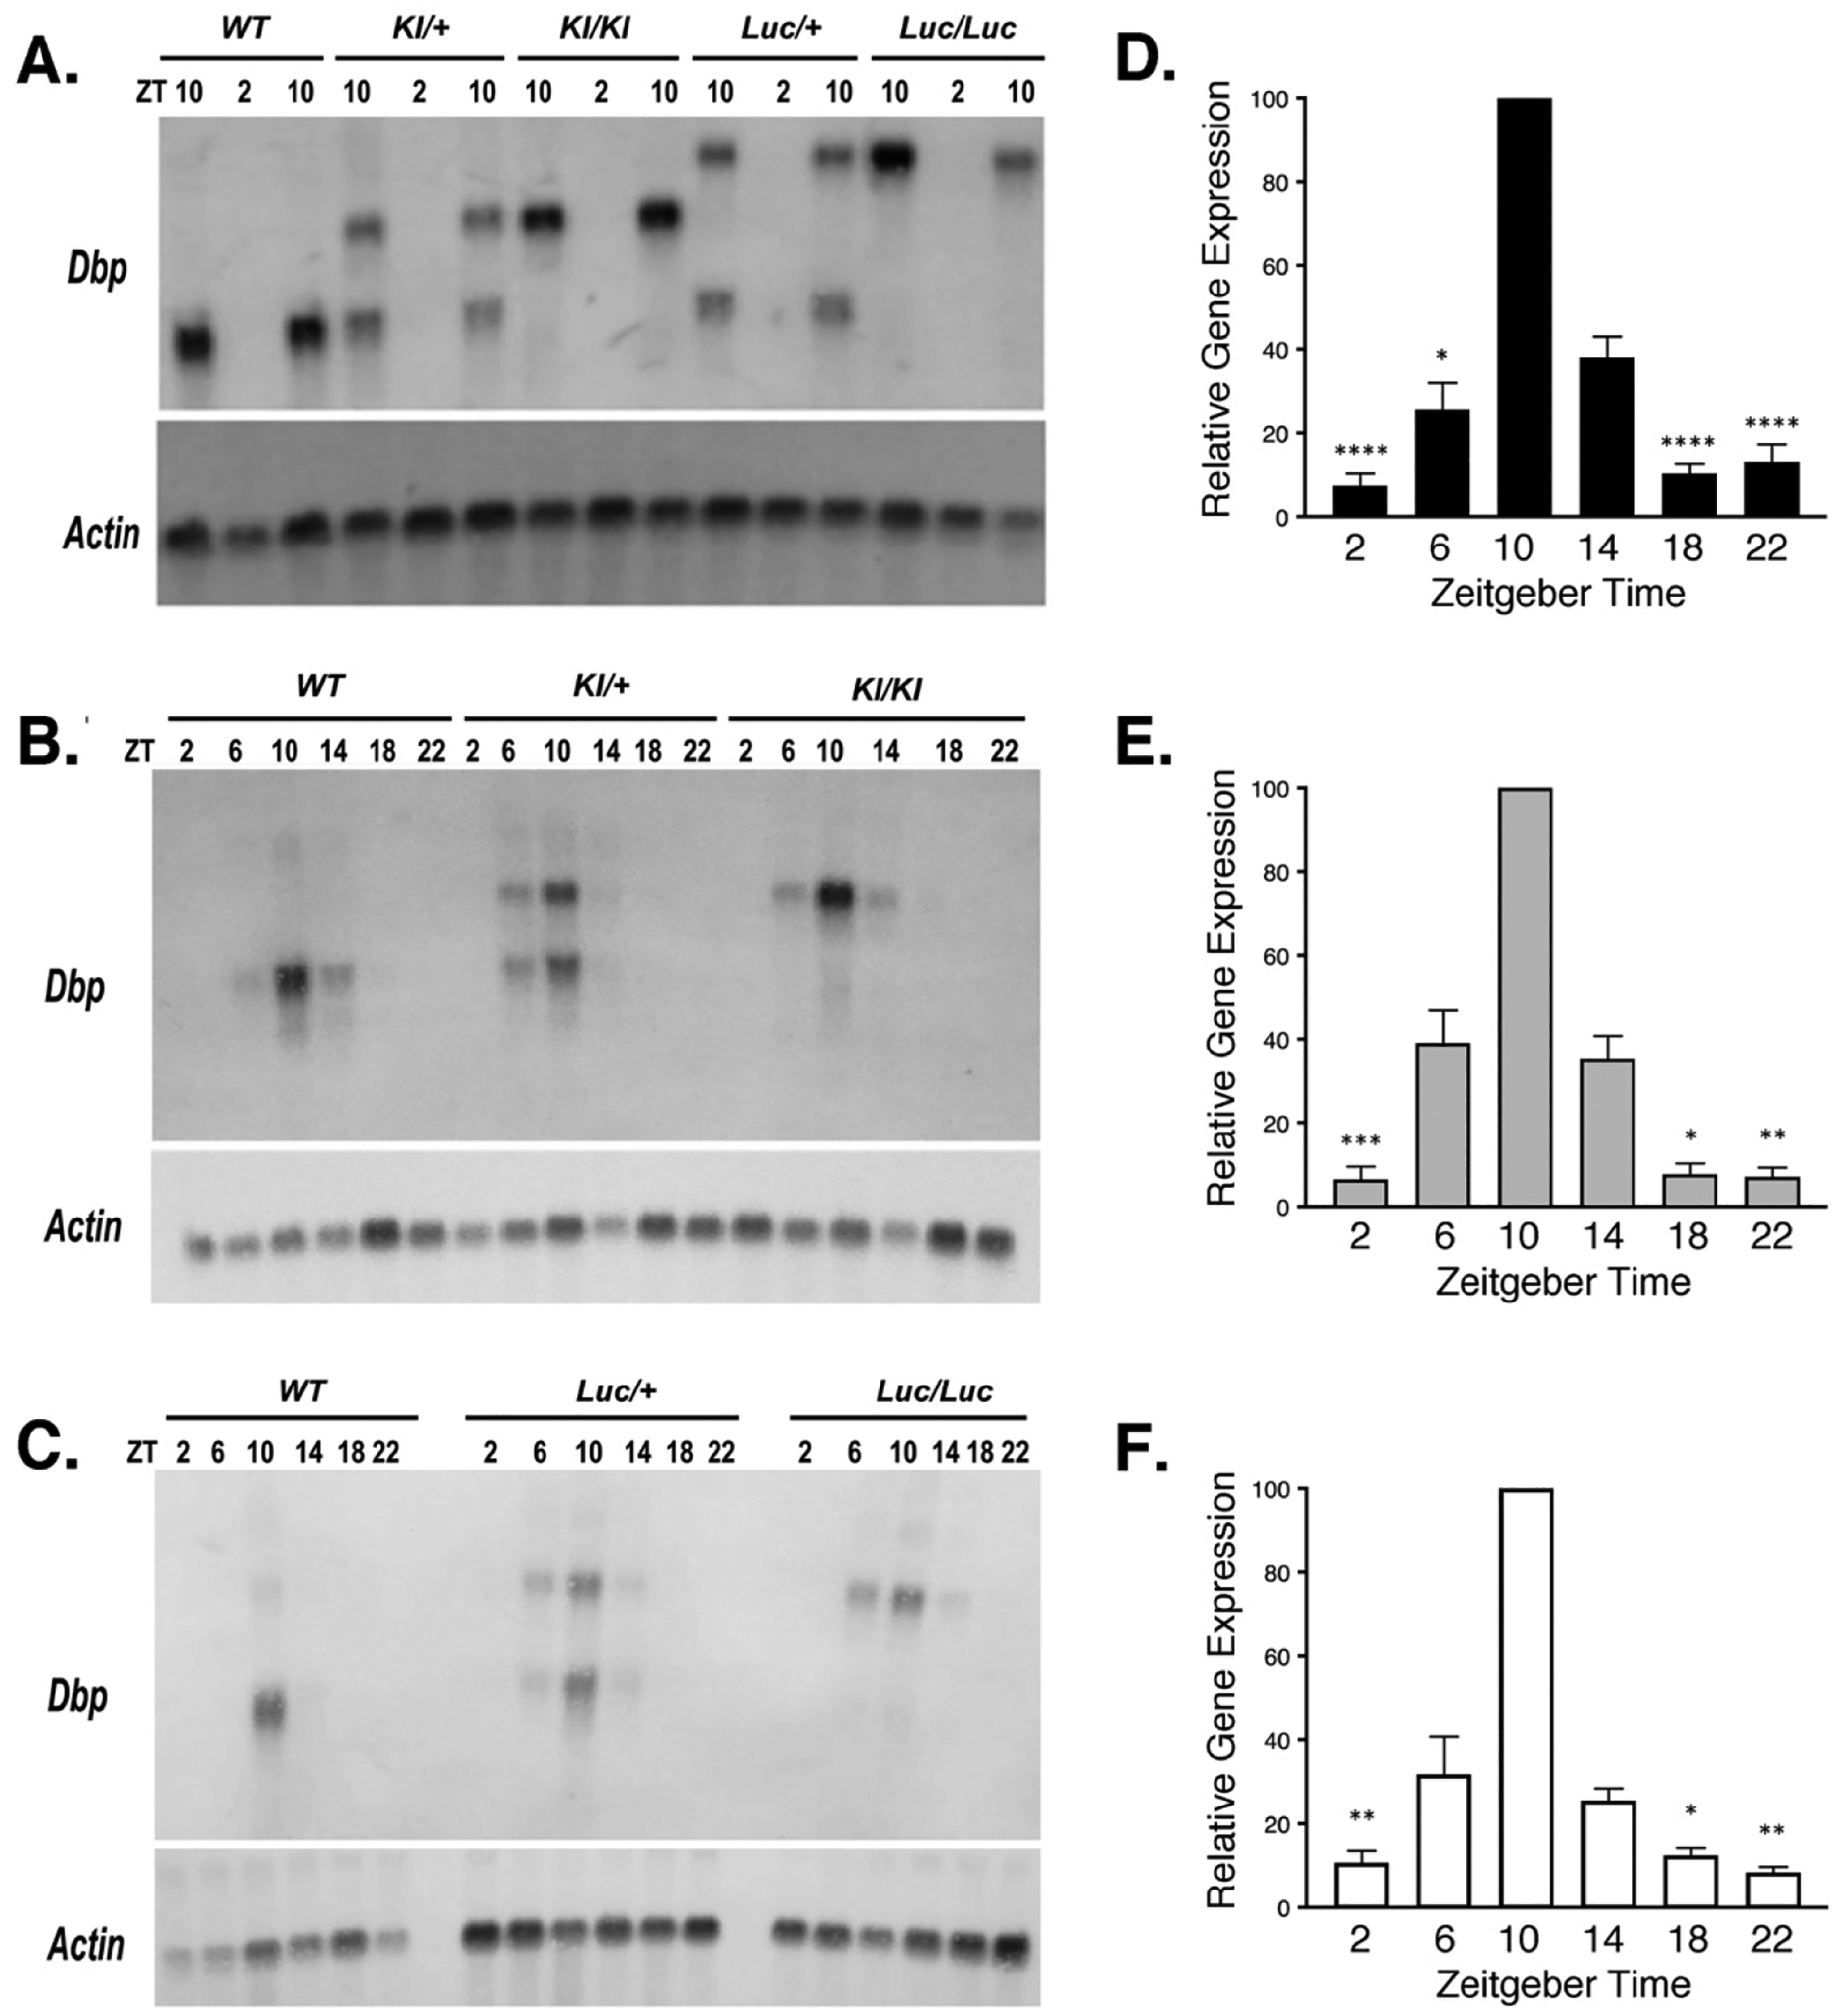
Figure 2. Dbp mRNA rhythms are not altered in reporter mice.

A-C. Representative Northern Blots probed to detect Dbp and Actin mRNA. A. From each of five genotypes, RNA samples were extracted from livers collected at ZT 2 and 10. For each genotype, there are two samples at ZT10 and one sample at ZT2 on this blot. B. and C. Representative Northern Blots of RNA samples collected from WT and reporter mouse livers at each of six Zeitgeber times (ZT).
D-F. Quantification of Dbp mRNA rhythms for each allele in time-series experiments (6 time-points each). Results are expressed as mean (± SEM) percent of the peak Dbp/Actin ratio, which occurred at ZT 10 on every blot. D. Wild-type Dbp transcript (n=12 sample sets). E. DbpKI transcript (n= 6). F. DbpLuc transcript (n= 6). For each transcript, there was a significant rhythm (Friedman’s One-way ANOVA, Q > 19, p < 0.002). Asterisks indicate time-points that differed significantly from ZT10 (Dunn’s test, * p < 0.05, ** p < 0.01, *** p < 0.001, **** p ≤ 0.0001). Significant differences among some other time-points are not shown for clarity.
