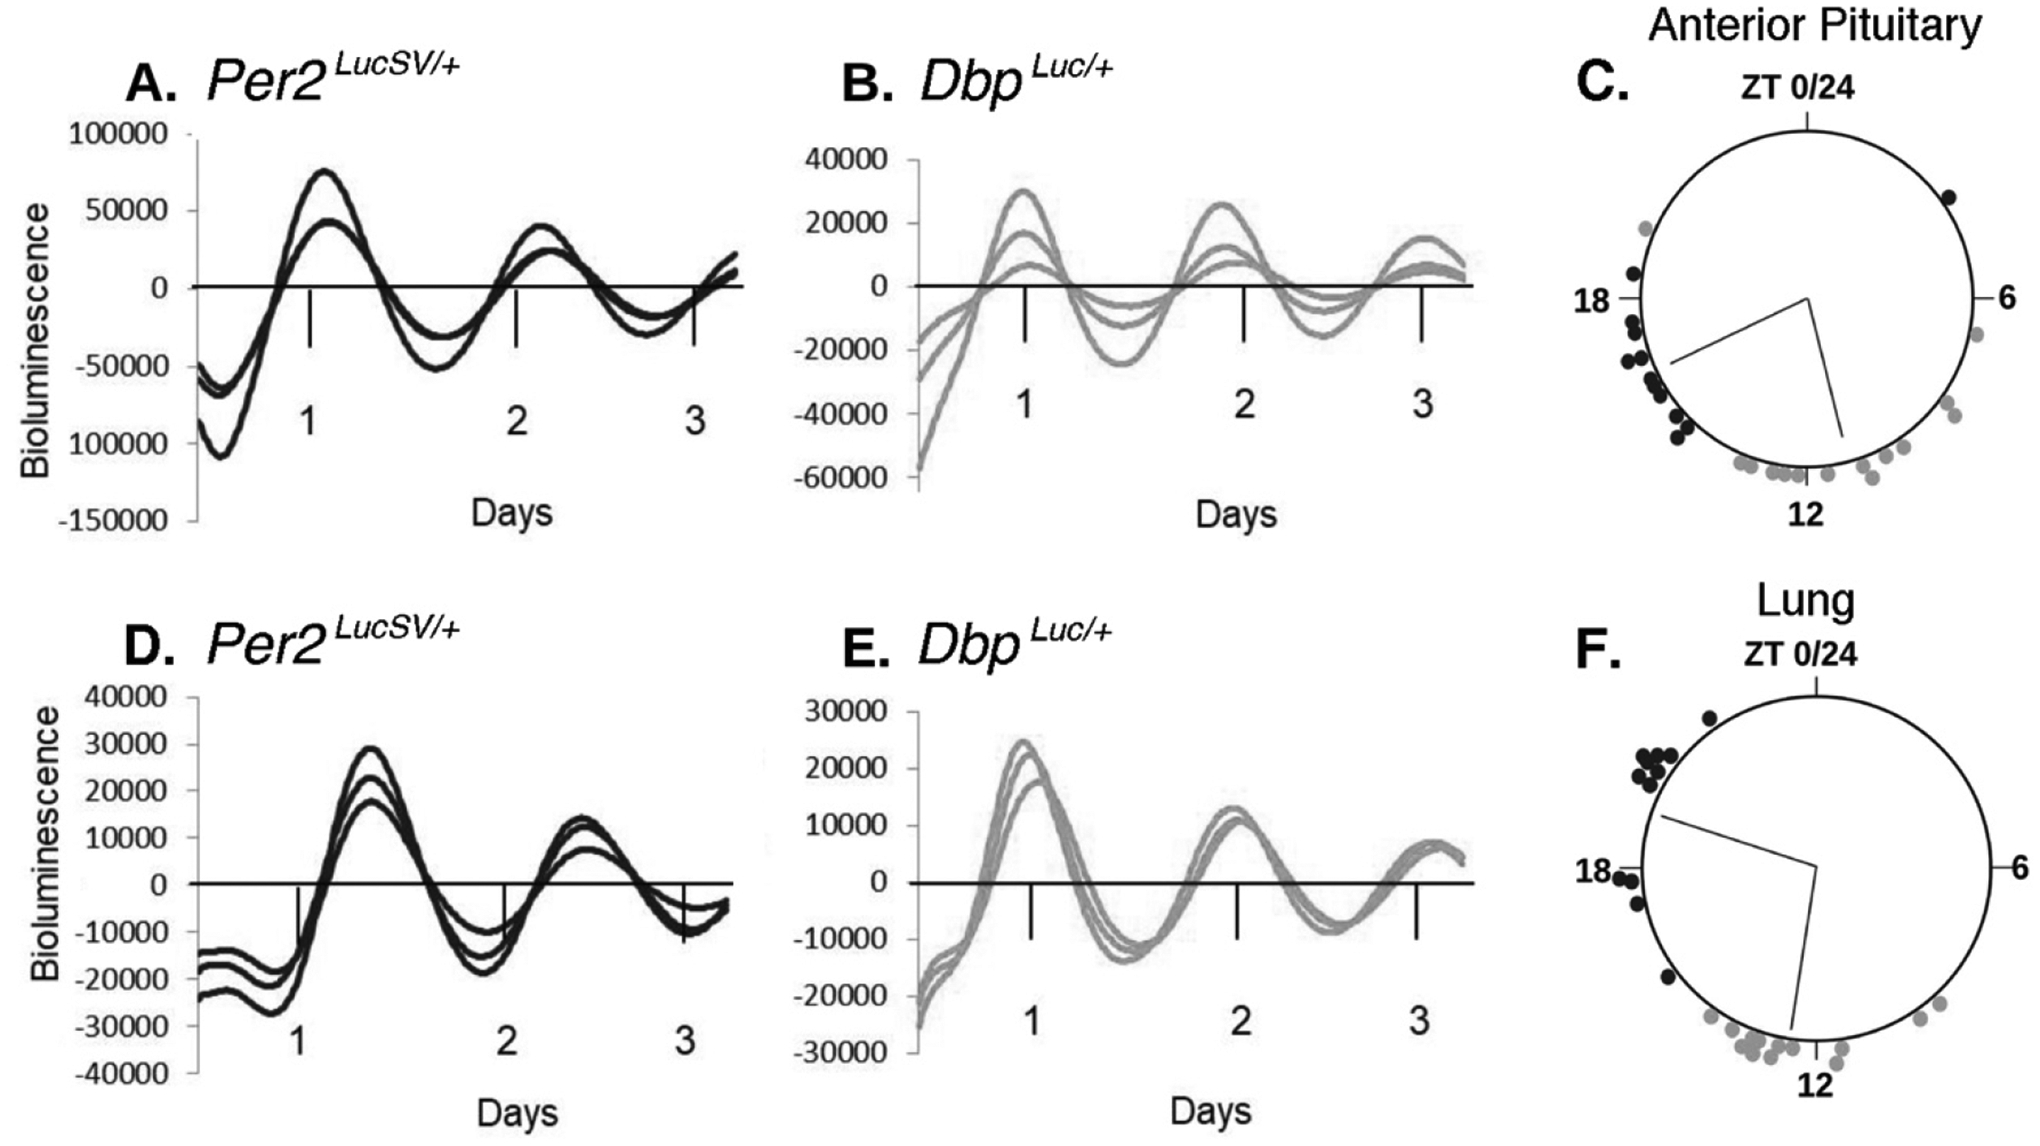
Figure 3. Ex vivo bioluminescence rhythms from Per2LucSV/+ and DbpLuc/+ tissue explants.

A-C., Anterior Pituitary gland. D-F., Lung.
A., B., D., and E. are representative bioluminescence rhythms from triplicate tissue explants from Per2LucSV/+ (A., D.) and DbpLuc/+ mice (B., E.). ‘Days’ refers to time in culture, not projected ZT. Values are 24-h background-subtracted and 3-h smoothed.
C., F., Time of peak bioluminescence ex vivo. The large circles represent a 24-h day for each organ. ZT’s refer to the lighting cycle to which the mice were exposed prior to sample collection, with ZT0–12 being the light phase. Circles at the perimeter of the large circle indicate the timing of peak bioluminescence of individual Per2LucSV/+ (black) or DbpLuc/+ (gray) tissue explants (n=12–14 mice). Within each tissue/genotype combination, there was significant clustering of times of peak bioluminescence. Radial lines represent the mean peak time, which differed significantly between genotypes for each tissue (Watson-Williams test, p<0.001).
