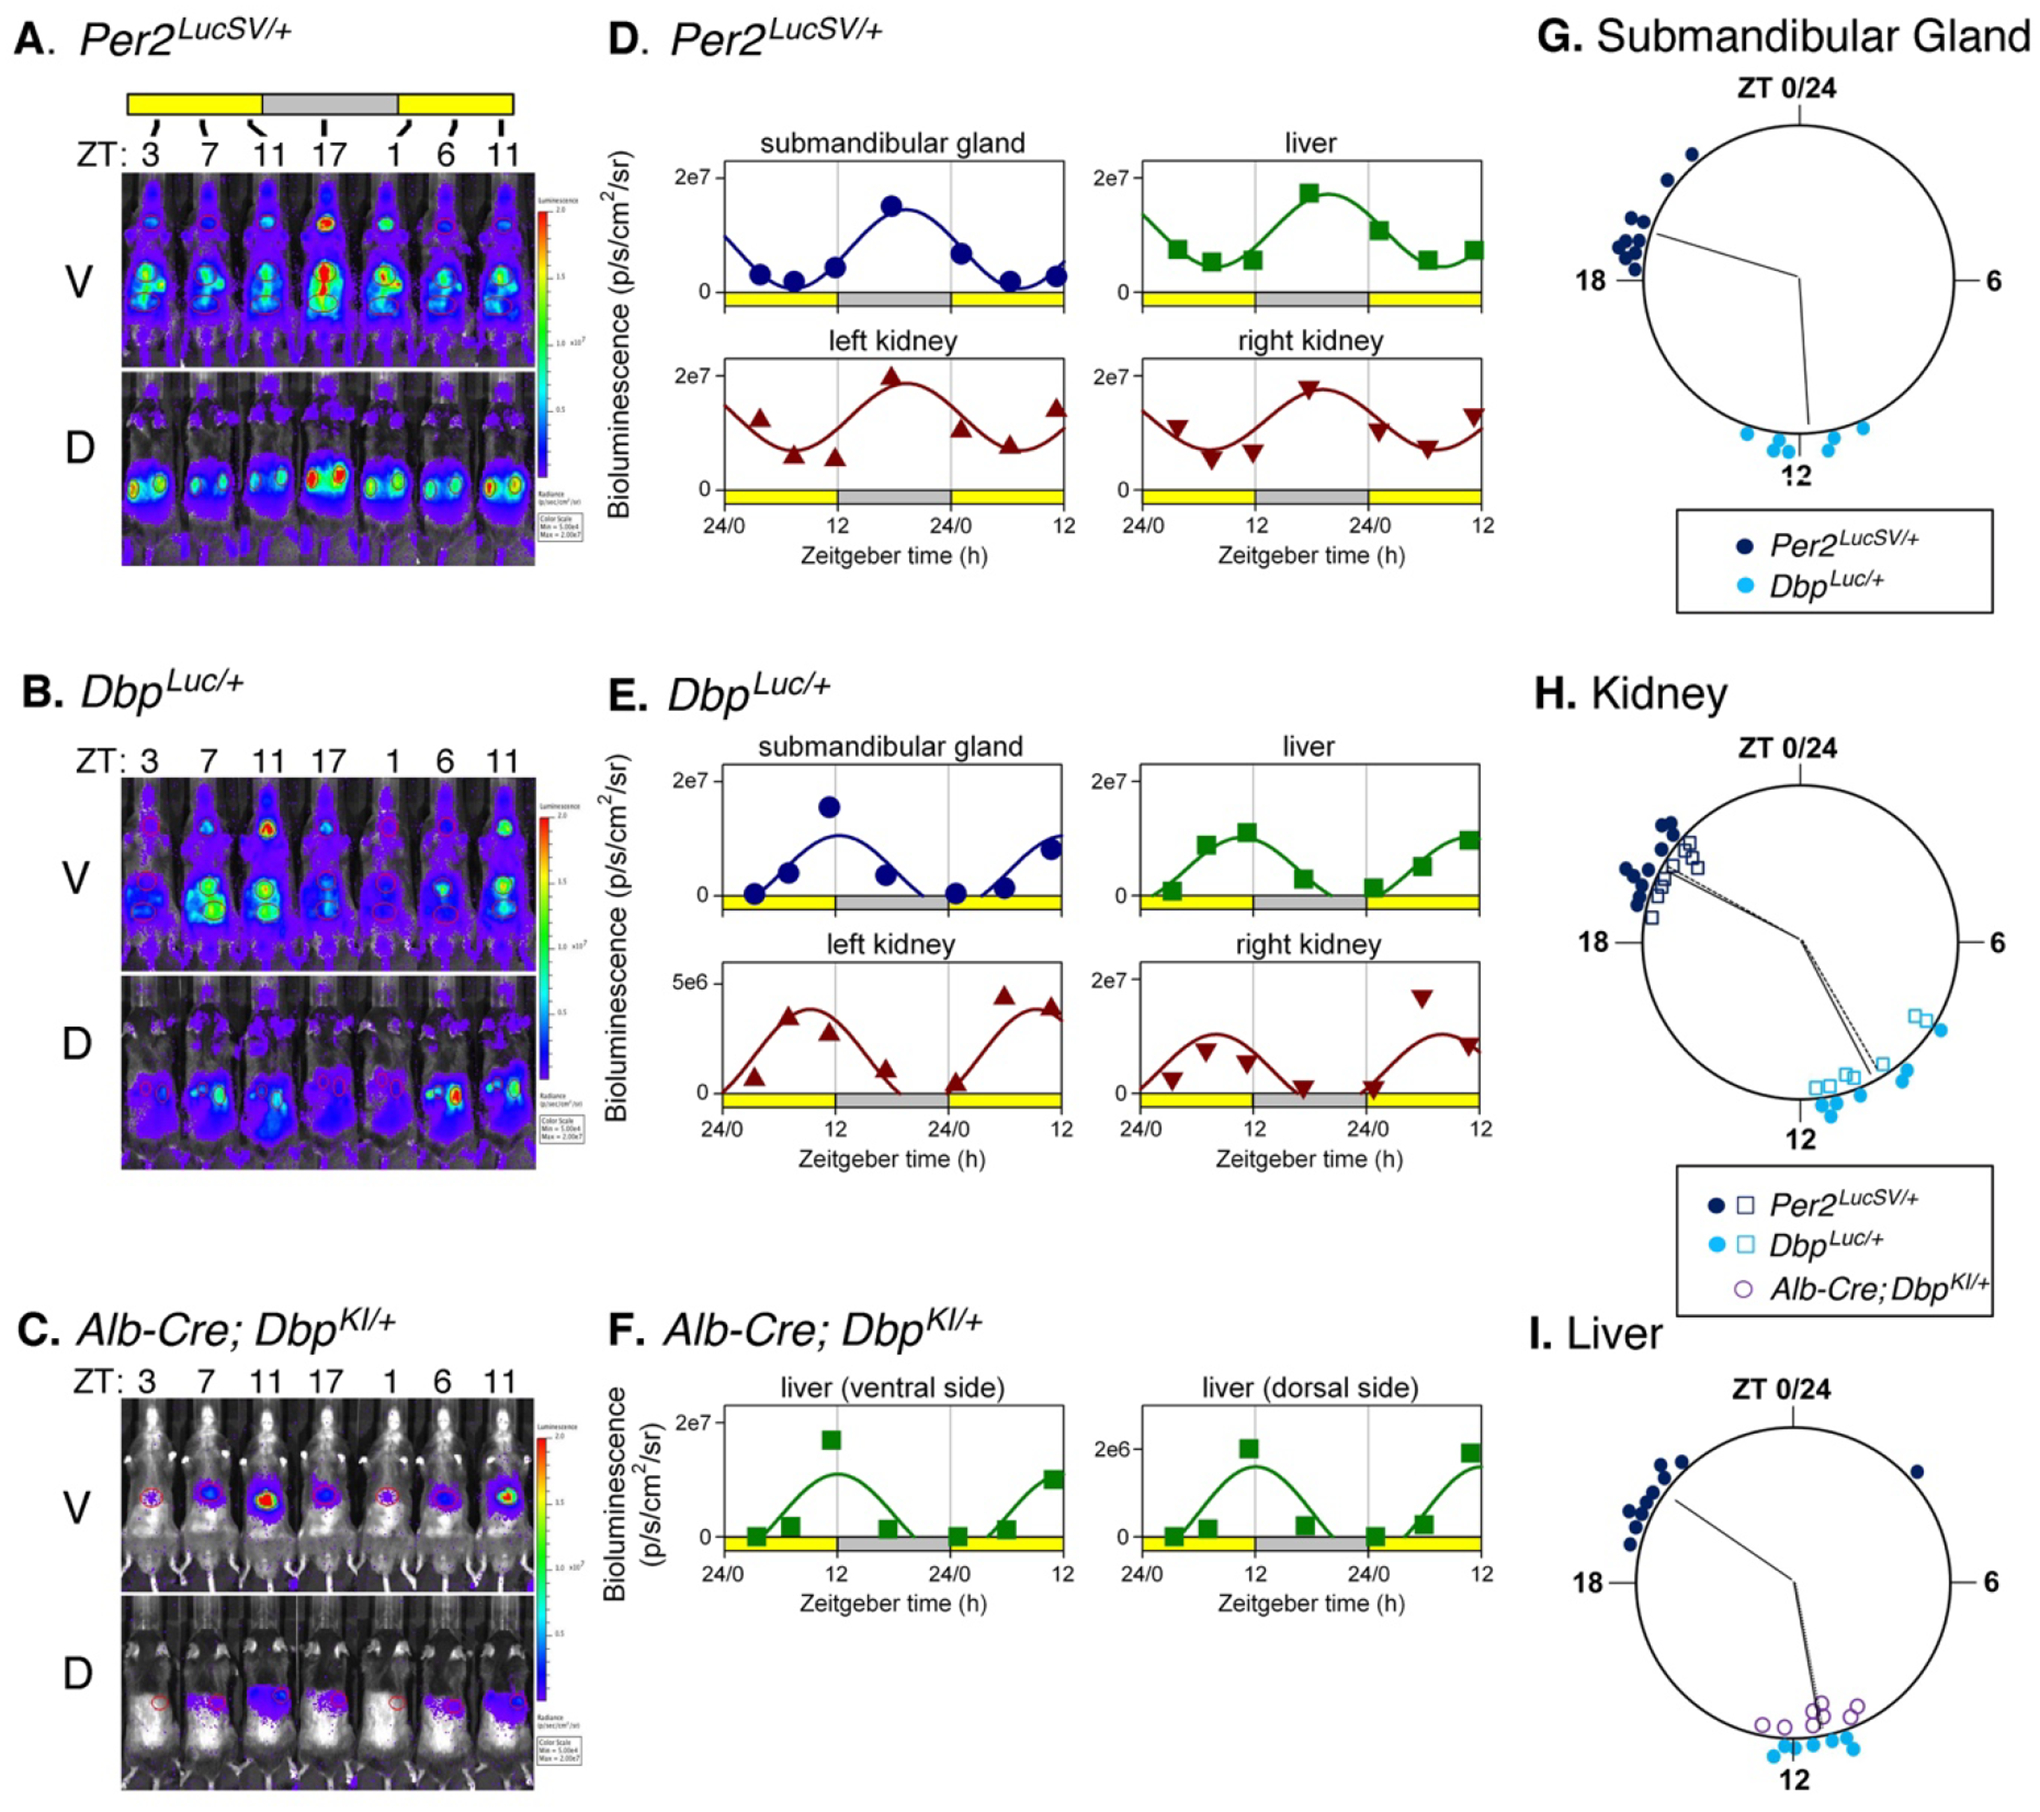
Figure 4. Bioluminescence rhythms measured in vivo.

A-C. Bioluminescence images captured at 4–6 hr intervals from a representative mouse of each genotype. A. Per2LucSV/+, B. DbpLuc/+ C. Alb-Cre+; DbpKI/+. Ventral (V) and dorsal (D) views are shown for each mouse. All images for each mouse are set to the same luminescence scale.
D-F. Cosinor-fitting of bioluminescence signal over time for the animals shown in Panels A-C to determine peak time. Bioluminescence rhythms were assessed in submandibular gland, liver, and kidneys of (D.) Per2LucSV/+ and (E.) DbpLuc/+ reporter mice, and from liver of Alb-Cre+; DbpKI/+ mice (F.).
G-I. Time of peak bioluminescence in vivo. G. Submandibular gland, H. Kidneys, and I. Liver. Data plotted as in Fig. 3. Per2LucSV/+ tissues (n=10, dark blue), DbpLuc/+ tissues (n=7, teal). In Panel H, open squares and filled circles represent the right and left kidneys, respectively. In Panel I, purple circles represent livers from Alb-Cre+; DbpKI/+ mice (n=8). Radial lines represent the mean peak time for each genotype and tissue. Radial lines from the two kidneys of a genotype are nearly overlapping. For liver, radial lines for the two Dbp reporter lines are overlapping and appear as a single line. Within each organ examined, time of peak differed significantly in Per2LucSV/+ explants compared to DbpLuc/+ and Alb-Cre+; DbpKI/+ explants (p=0.002, Watson-Williams test). There was no significant difference in peak time between DbpLuc/+ and Alb-Cre+; DbpKI/+ liver tissues (p>0.05).
