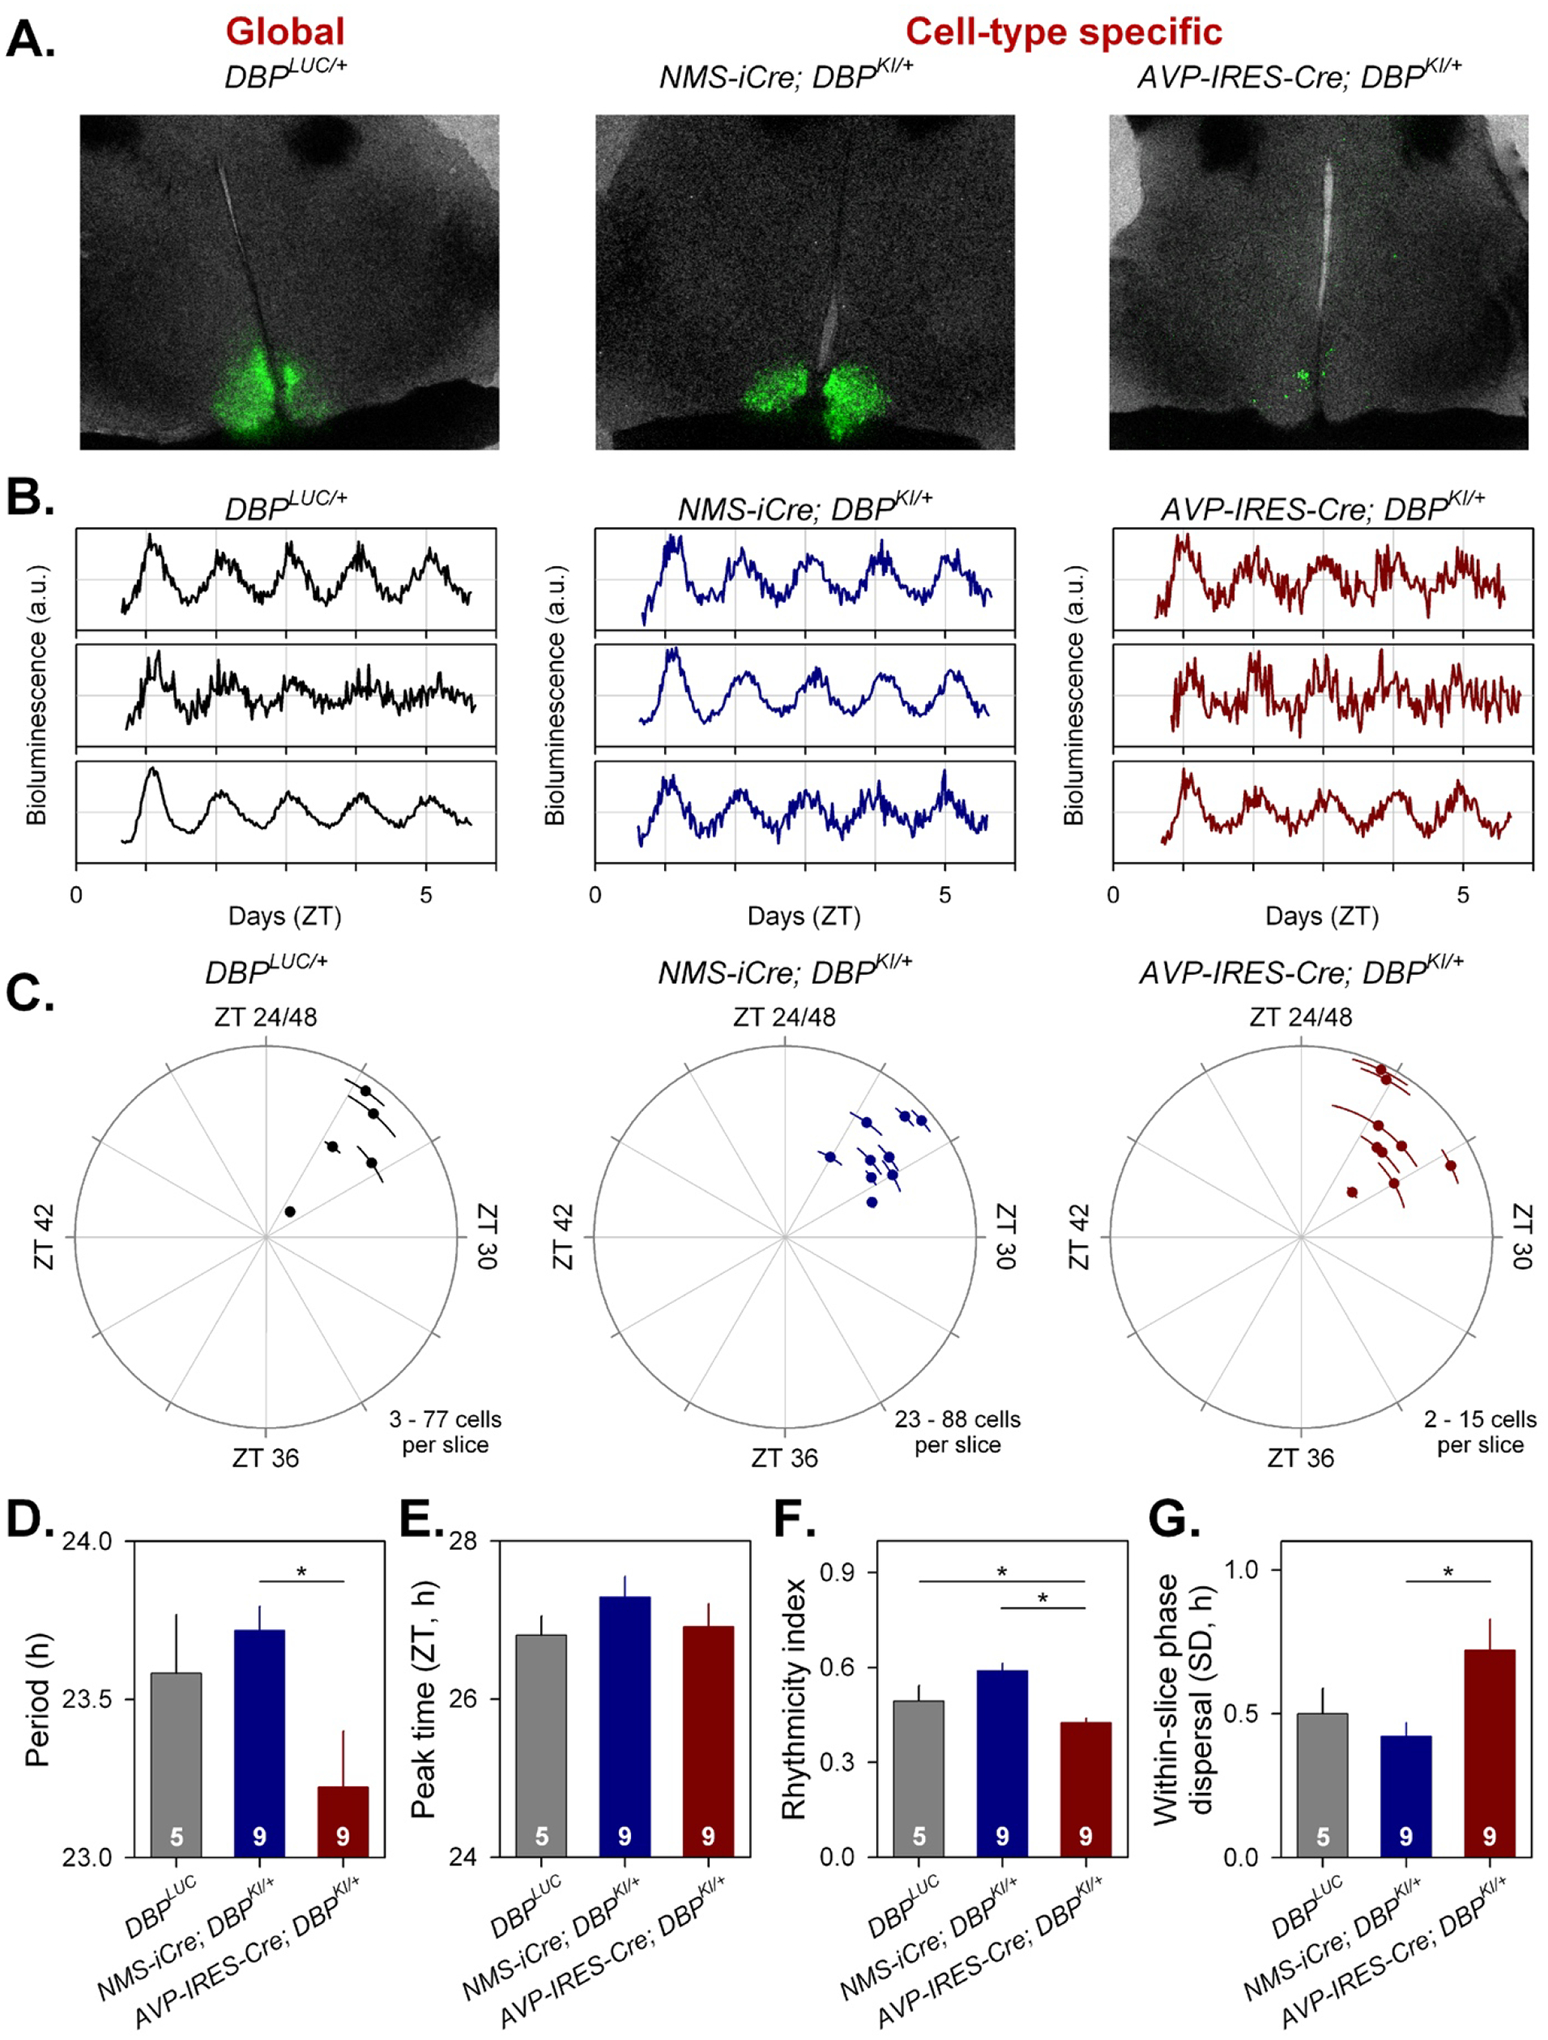
Figure 5. Cell-type-specific imaging of luciferase expression in SCN slices.

A) 24h summed bioluminescence overlaid onto bright field images of a section through the SCN from DbpLuc/+ (global reporter expression, left), and in mice expressing luciferase from specific subsets of SCN neurons (NMS+ cells, center; AVP+ cells, right).
B. Representative bioluminescence traces from single neuron-like ROIs in slices from each genotype.
C. Circular plots indicate the peak time of bioluminescence rhythms from each genotype. Time is expressed relative to the light-dark cycle the mice were housed in prior to sacrifice; numbers >24 are used to indicate that these measures are recorded on the first day in culture and are plotted relative to the previous lighting conditions. Each slice is represented by a small dot. Placement of the dot relative to outer circle indicates average peak time (±SD), while the distance from the center corresponds to the number of cells incorporated in the average (√cell#).
D-G. Rhythm parameters by genotype. The number of slices per genotype is indicated at the base of each bar.
D. Mean period (± SEM).
E. Circular mean peak time (± SEM).
F. Mean rhythmicity index score (± SEM).
G. Mean peak time dispersal (quantified by circular SD of peak times within each slice).
