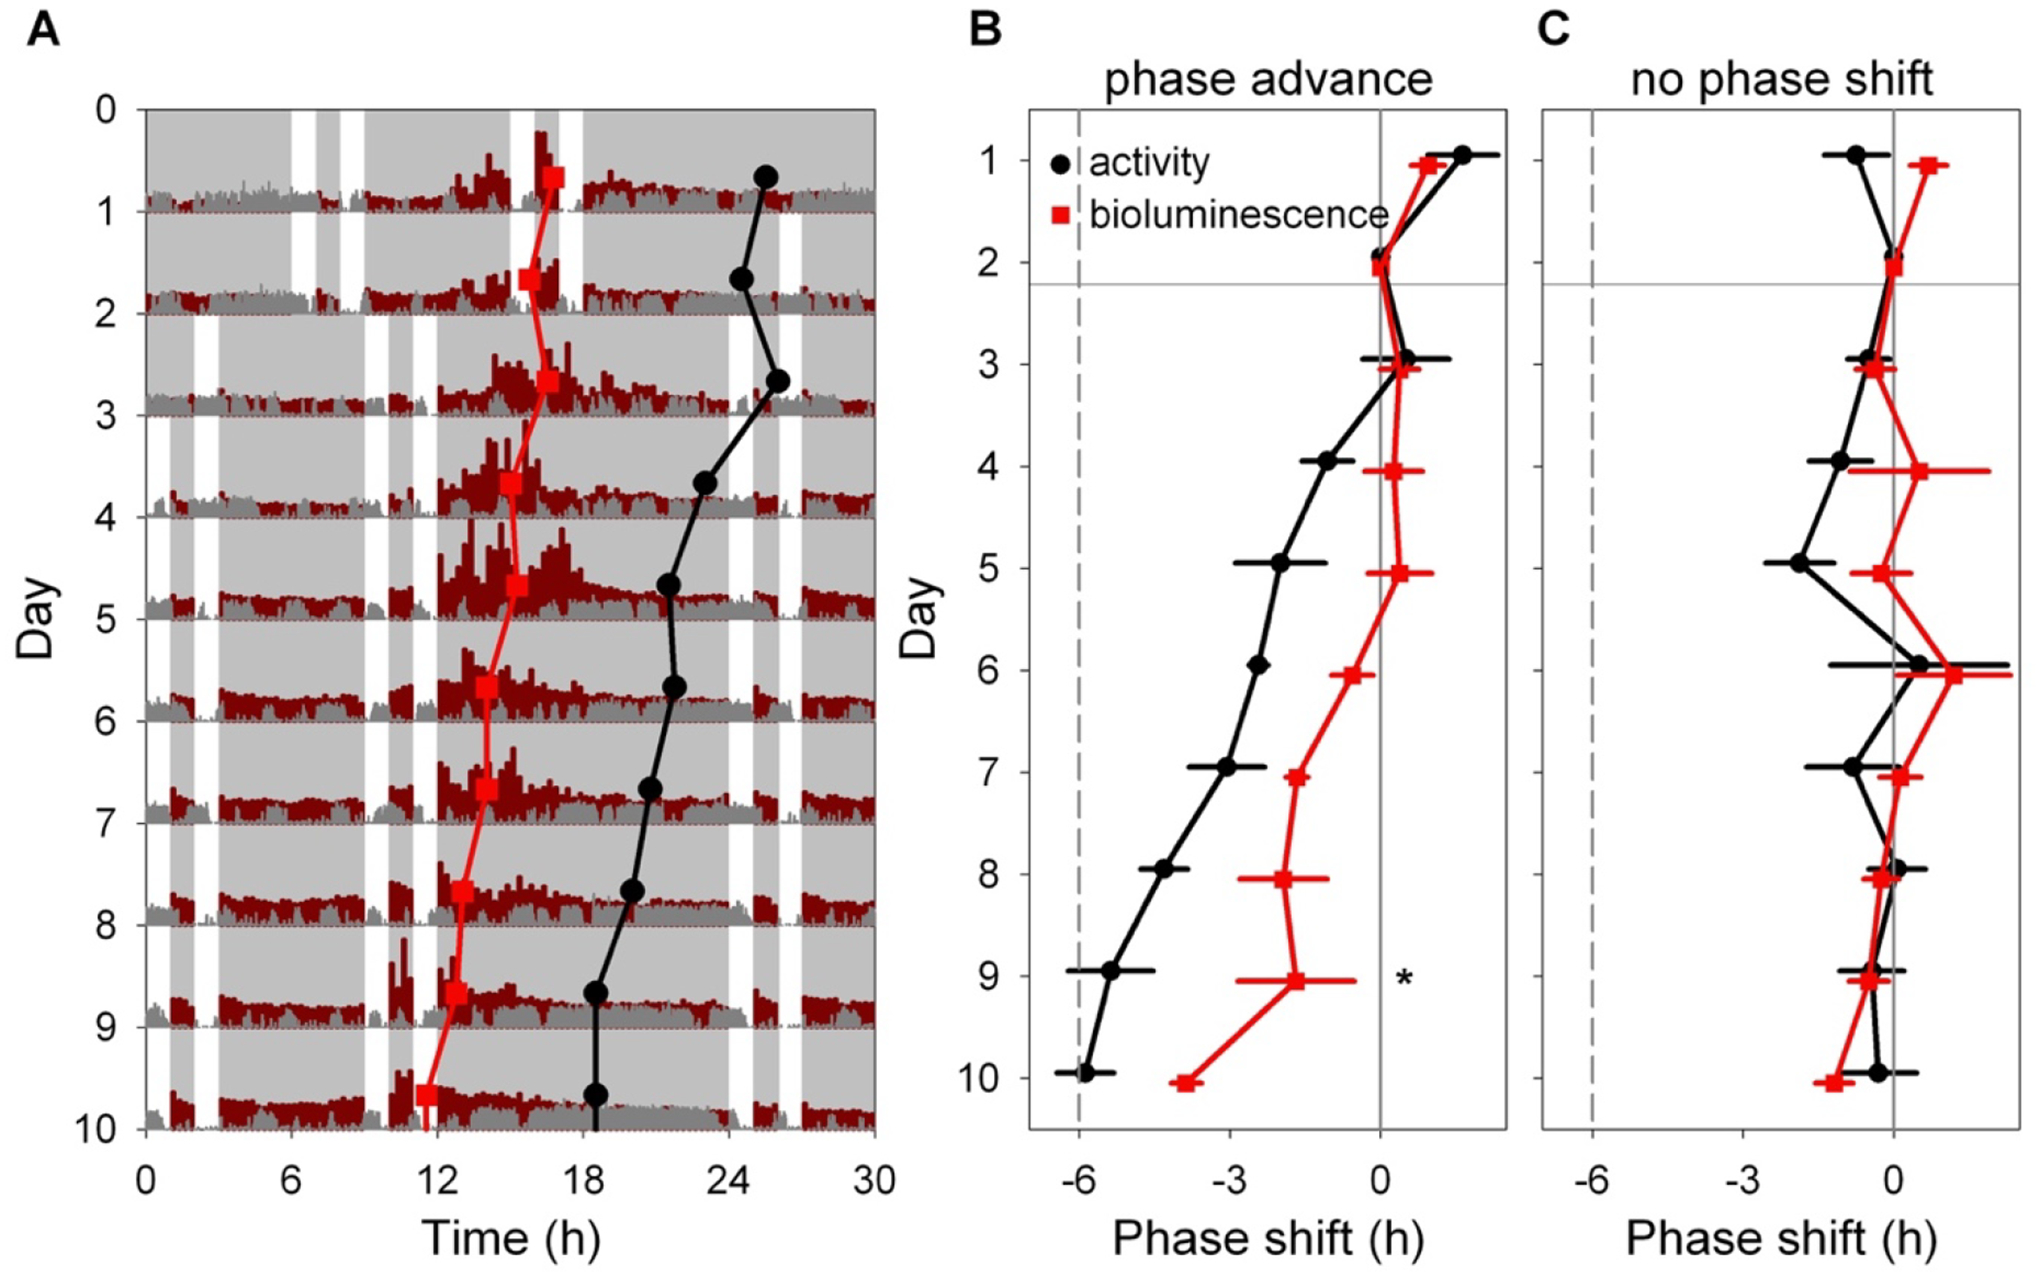
Figure 6. Light-induced resetting produces misalignment between rhythms in liver bioluminescence and locomotor activity.

A. Representative double-plotted actogram showing locomotor activity (dark gray) and bioluminescence (dark red) of an Alb-Cre; DbpKI/+ liver reporter mouse before and after a 6-h advance of the skeleton photoperiod consisting of four 1-h periods of light per 24-h day, as indicated by white. The skeleton photoperiod was advanced by 6 h by shortening the dark phase after the last light pulse on Day 2. Red squares represent the peak of the bioluminescence rhythm, while black circles represent the midpoint of locomotor activity each day, determined by discrete wavelet transform analysis. Six hours of each cycle are double-plotted to aid visualization. Light and dark are indicated by white and gray backgrounds, respectively.
B. Mean (± SEM) midpoint of locomotor activity (black) and peak of liver bioluminescence (red) rhythms are shown, relative to their initial value, in a group of 4 mice exposed to a 6-h phase advance of the skeleton photoperiod. The locomotor activity rhythm re-sets more rapidly than the bioluminescence rhythm within animal (Significant Measure * Day interaction, and significant phase difference between the rhythms on Day 9; Tukey HSD, p <0 .05).
C. Mean (± SEM) time of midpoint of locomotor activity (black) and peak liver bioluminescence (red) rhythms are shown, relative to their initial phase, in a group of 4 mice not subjected to a phase shift of the skeleton photoperiod.
