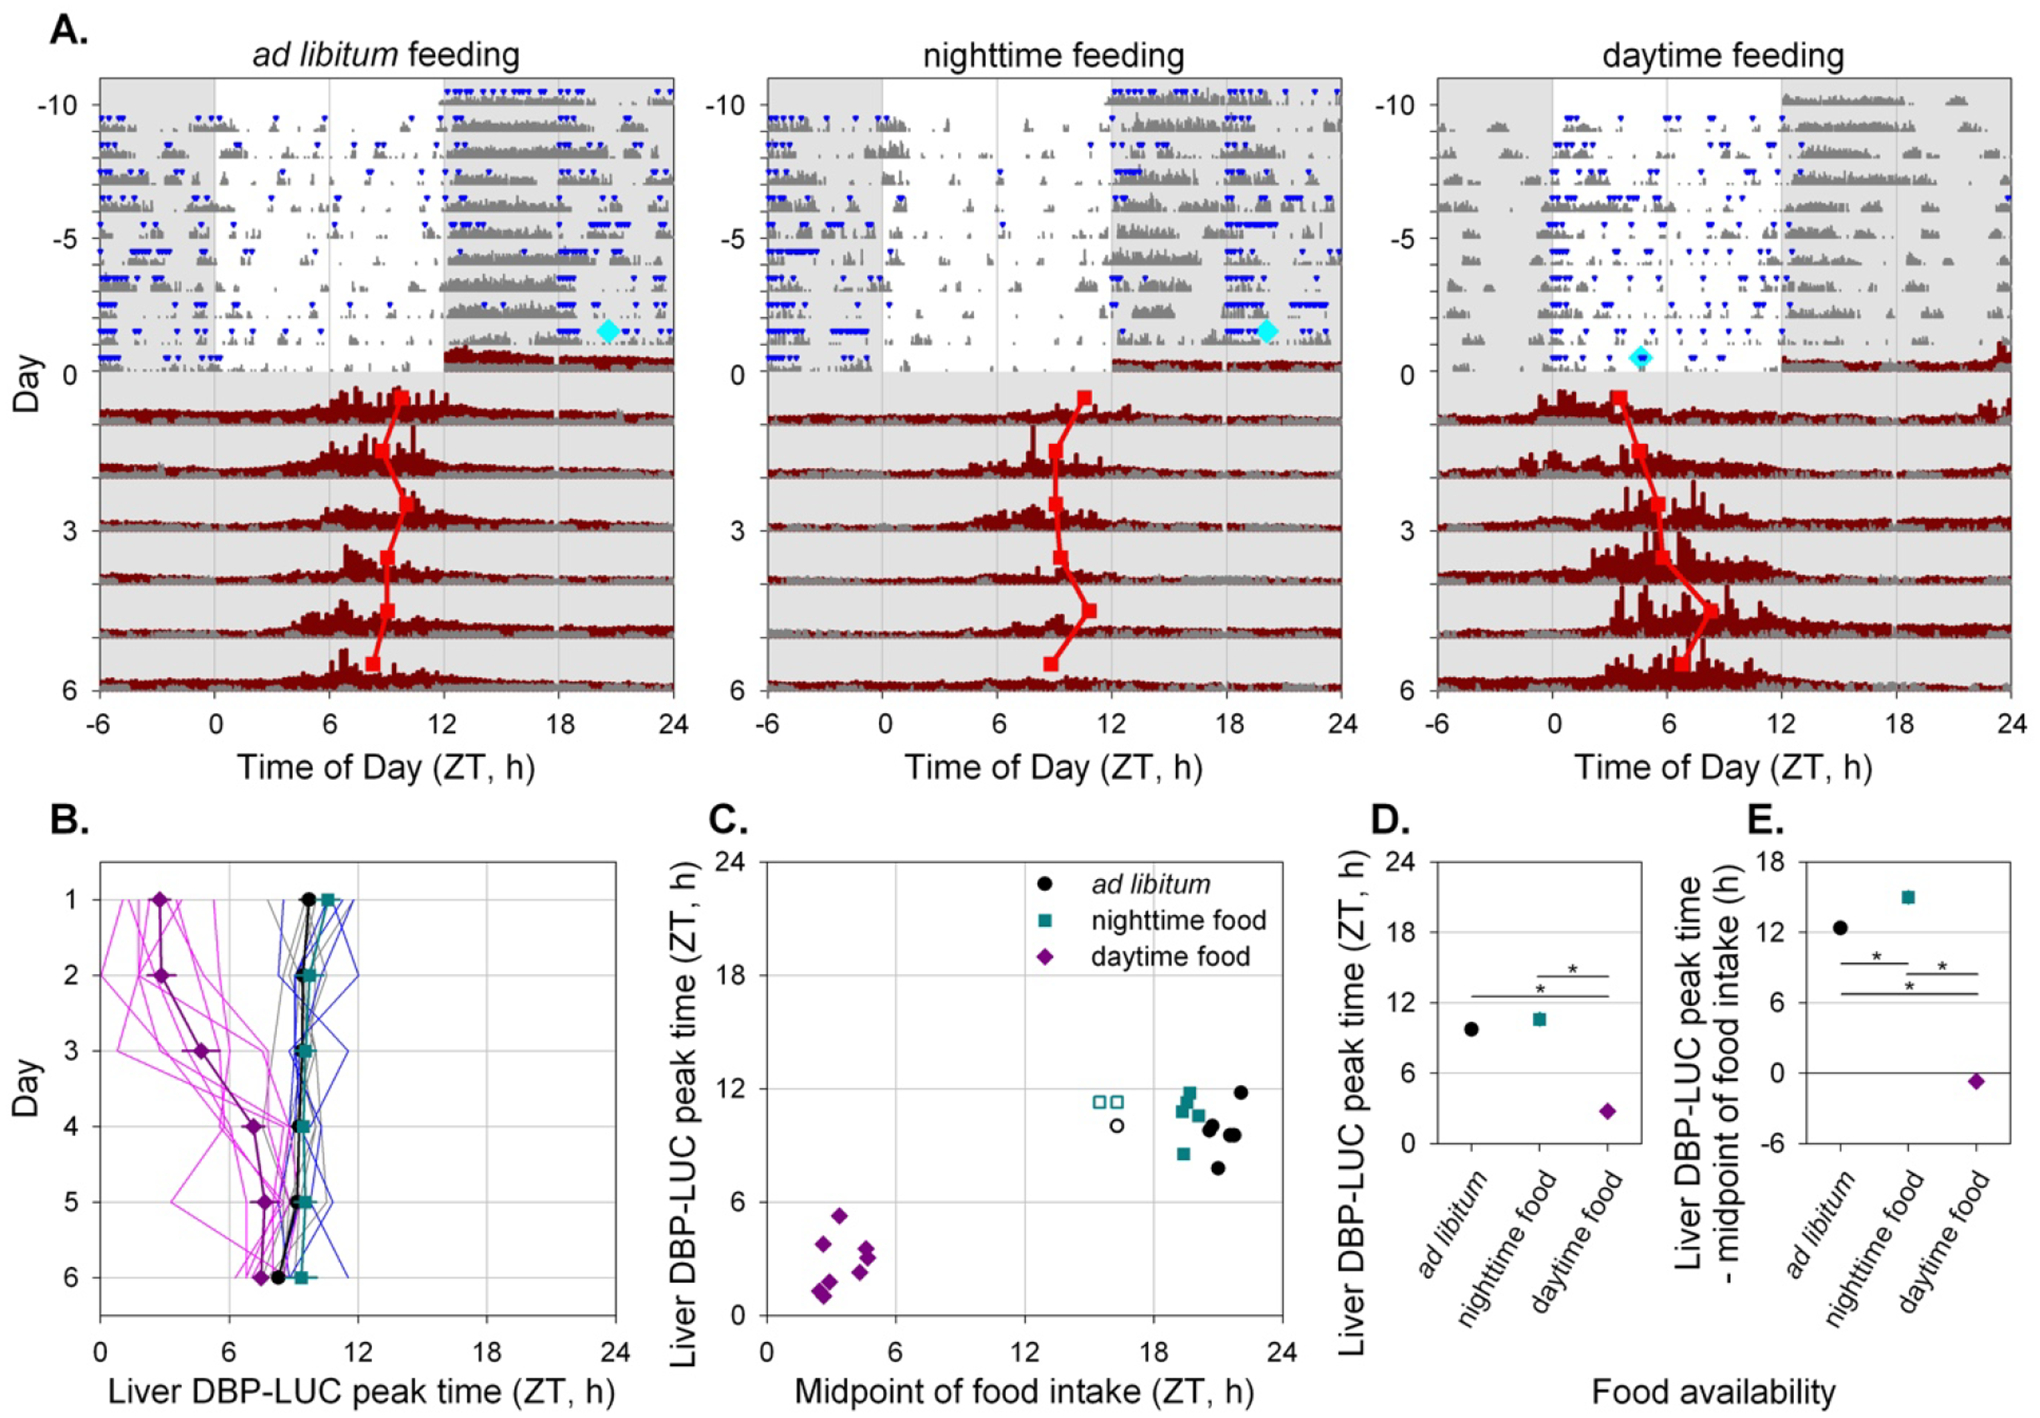
Figure 7. Time-restricted feeding alters the timing of liver bioluminescence rhythms.

A. Representative actograms of three Alb-Cre; DbpKI/+ liver reporter mice exposed to the different feeding regimes as indicated above each panel. Mice were housed in 12L:12D lighting and exposed to the specified feeding regime for ten days (−10 to 0) before bioluminescence recording. Food intake (blue triangles) and general locomotor activity (dark gray) were recorded continuously. The midpoint of food intake from days −5 to 0 is indicated by a cyan diamond on day 0. Mice were transferred to the bioluminescence recording setup at the start of the dark phase and housed in constant darkness with ad libitum food access. Liver bioluminescence levels are depicted in dark red. Red squares represent the time of peak of the bioluminescence rhythm, determined by DWT. Six hours of each cycle are double-plotted and the y-axis has been stretched during the last 6 days to aid visualization. Light and dark are indicated by white and gray backgrounds, respectively.
B. ndividual and mean (± SEM) phase of liver bioluminescence rhythms relative to clock time for three feeding groups. Mice previously exposed to ad libitum, nighttime and daytime feeding are plotted in grey/black, blue/cyan and magenta, respectively (key in Panel C). Prior to recording bioluminescence, mice were entrained to a 12L:12D lighting cycle with lights on at 0600. Mice previously exposed to daytime feeding show an advanced peak phase of liver bioluminescence that reverts over time in constant darkness with ad libitum food.
C. Relationship between preceding feeding phase and peak liver bioluminescence phase for individual animals on the first day under constant conditions. Ad libitum and night-fed groups had similar midpoint of food intake; three “outliers” with respect to midpoint of food intake (shown by open symbols) were not included in further analyses (Panels B, D and E).
D. Mean (± SEM) peak liver bioluminescence phase on the first day under constant conditions, relative to clock time for the three feeding regimens. Error bars were nearly or completely contained within the symbols.
E. Mean (±SEM) peak liver bioluminescence phase on the first day under constant conditions, relative to the midpoint of preceding food intake for the three feeding regimens. Error bars were nearly or completely contained within the symbols.
