
Figure 3.
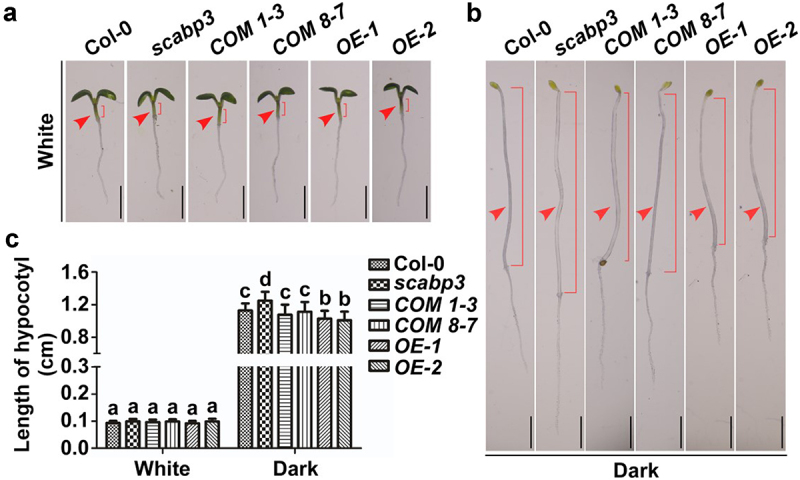
Hypocotyl growth phenotypes of Arabidopsis seedlings with different SCaBP3 genotypes. (a) Hypocotyl growth phenotypes of Col-0, scabp3 and its two complementation lines, and two SCaBP3 overexpression lines under continuous white light conditions. (b) Hypocotyl growth phenotypes of Col-0, scabp3 and its two complementation lines, and two SCaBP3 overexpression lines under dark conditions. (c) Statistical analysis of the hypocotyl lengths in (a) and (b). Two-way ANOVA was used to determine statistical significance; significance differences between the experimental groups (P ≤ .05) are indicated by different lowercase letters. The red arrows indicate the hypocotyls, and the red brackets indicate the hypocotyl lengths.