
Figure 4.
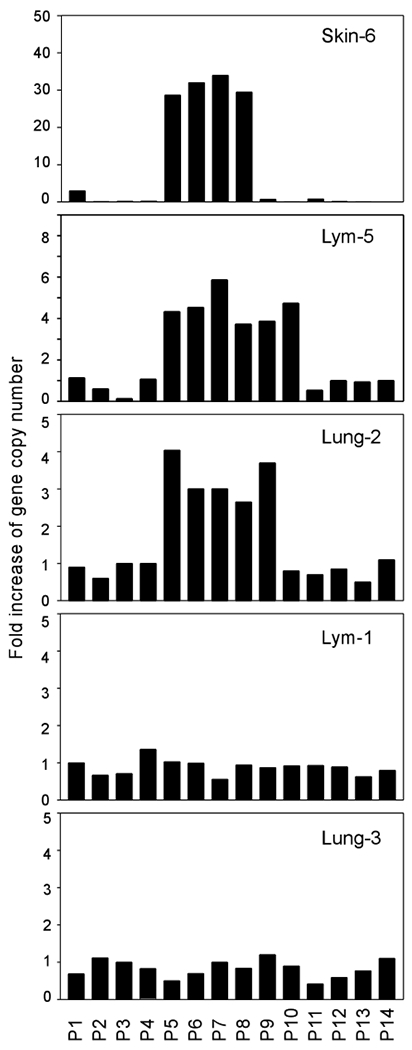
Mapping CoAA amplicons in lung cancer, skin cancer, and lymphoma. Quantitative real-time PCR results are shown using DNA from tumors with identifying numbers corresponding to numbers in Figure 2. The locations of 14 primer pairs (P1-P14) used in the mapping are shown in Figure 3. Two non-amplified tumors, a lymphoma and a squamous cell lung cancer were used as negative controls. Fold increase of gene copy number was determined as in Figure 2.