
Figure 8.
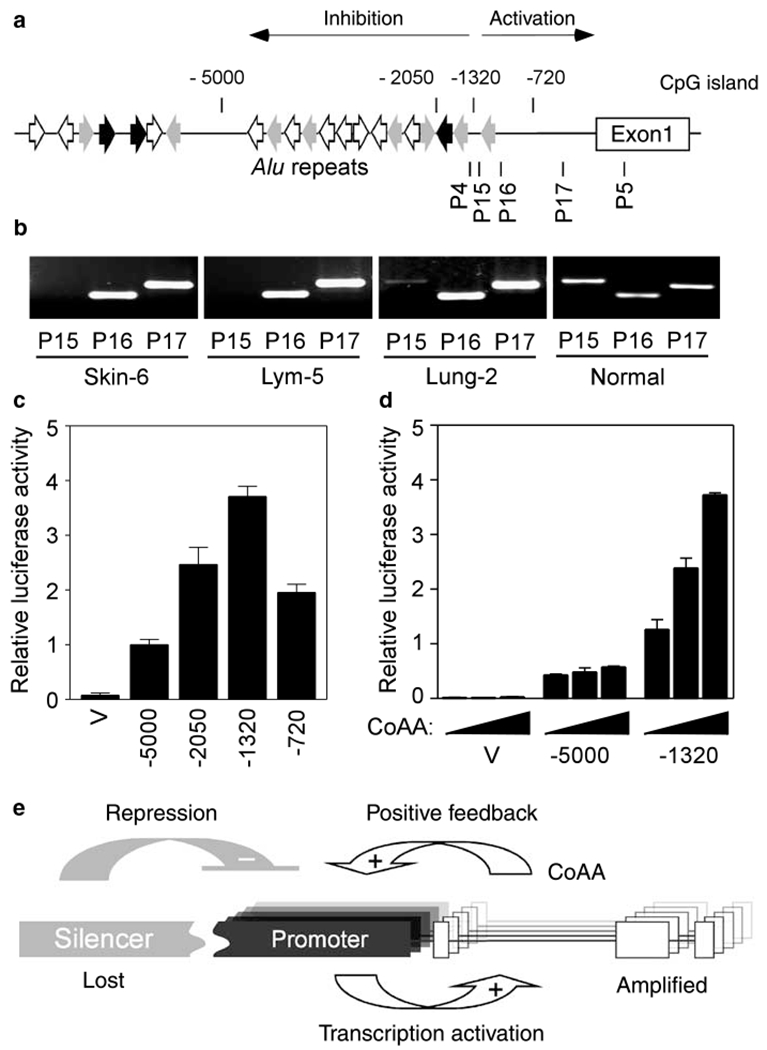
Loss of silencing sequence leads to stimulated CoAA promoter activity. (a) Schematic diagram of the regulatory region of the CoAA gene. Alu repeats are shown by orientated arrows. Numbers above the diagram indicate the promoter fragments used for reporter assays. A potential CpG island predicted by the NCBI is indicated. The positions of primer pairs (P15, P16 and P17) used for PCR in b are indicated. (b) PCR analysis for 5′ ends of the amplicons in three amplified tumors. PCR positions in the sequence are indicated in a. Normal genomic DNA is control. (c) Promoter activities of the CoAA gene were determined using a luciferase reporter system. The length of the promoter fragments are from number as indicated to +1. The positions of these deletions are shown in a. (d) CoAA stimulates its own promoter. Increasing amounts of CoAA expression plasmids (0, 0.2, 0.4 μg) were cotransfected with the luciferase reporters (0.1 μg) containing CoAA promoter sequences as indicated. Relative luciferase activities were measured and shown as means of triplicate transfections ±s. e. (e) Model of CoAA activation in cancer. CoAA gene is activated through its basal promoter (in black) and inhibited by its upstream silencer (in gray). Overexpressed CoAA, produced by the amplified CoAA genes, stimulates its own promoter via a positive feedback loop. Loss of silencer leads to constitutive cycling of CoAA overexpression.