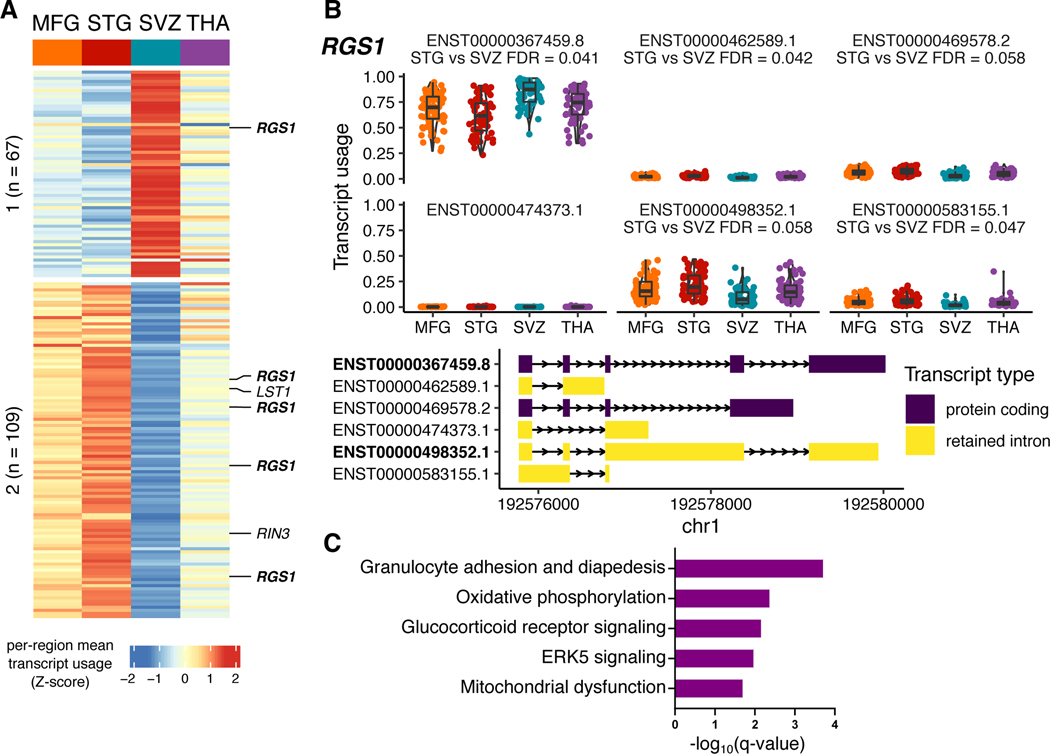
Extended Data Fig. 1. Regional heterogeneity analysis for transcript usage.
A) Heatmap of relative transcript usage between regions using all 176 transcripts from pairwise comparisons of differential transcript usage (DTU; empirical FDR < 0.1), plotted as row-scaled z-scores of mean transcript usage per region; red and blue indicates high and low relative transcript usage, respectively. Transcripts form 2 k-means clusters, n refers to the number of transcripts in each cluster. Core microglia genes from Patir et al. highlighted. B) Transcript usage plots for the gene RGS1. The two most abundant transcripts are bolded. The DTU signal is driven by a reduction of the intron retention transcript ENST00000498352.1 and a corresponding increase in the protein-coding transcript ENST00000367459.8 in the SVZ compared to the other regions. Boxplots show the median with the first and third quartiles of the distribution. C) Functional Enrichment Analysis of all 132 genes with regional DTU using Ingenuity Pathway Analysis (IPA). Significantly enriched terms shown (q-value < 0.05).

