Fig. 4.
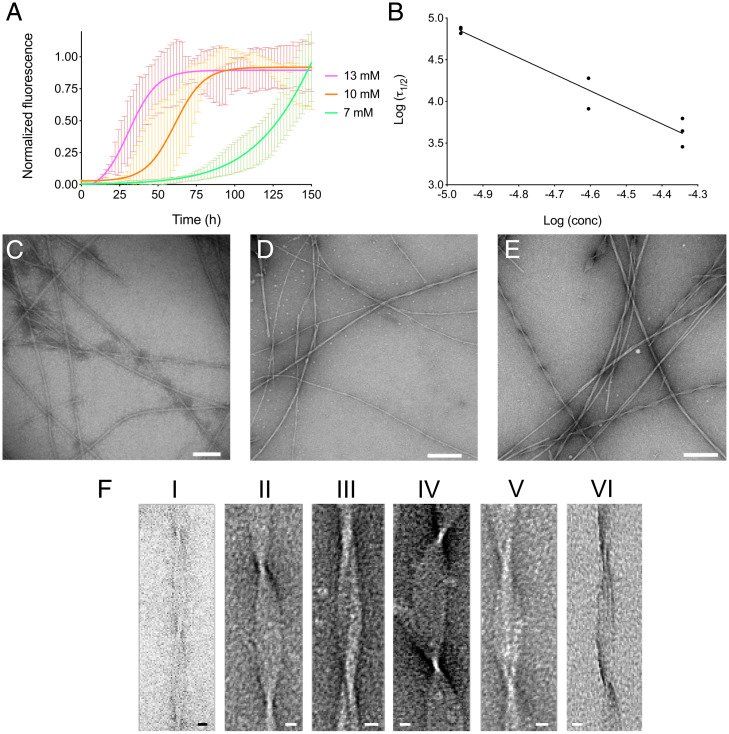
TTR peptide aggregation kinetics in vitro. (A) Aggregation kinetics of the TTR105–115 peptide at 13, 10, and 7 mM are shown in magenta, orange, and green, respectively. TTR peptide at 37 °C were obtained by monitoring ThT fluorescence. The mean value of three independent experiments analyzed by linear regression using Boltzmann sigmoidal equation is reported. (B) Log–log plot of the in vitro half-times, τ1/2, as a function of the initial monomer concentration. (C–E) Electron micrographs of fibrils formed by TTR105–115 peptide incubated at 13 mM (C), 10 mM (D), or 7 mM (E) at 37 °C for 150 h. (Scale bars, 100 nm, C; 200 nm, D and E.) (F) Representative TEM images of the six main fibrillar morphologies. The detailed structural parameters of each morphology are reported in SI Appendix, Table S2. (Scale bars: 10 nm.)

