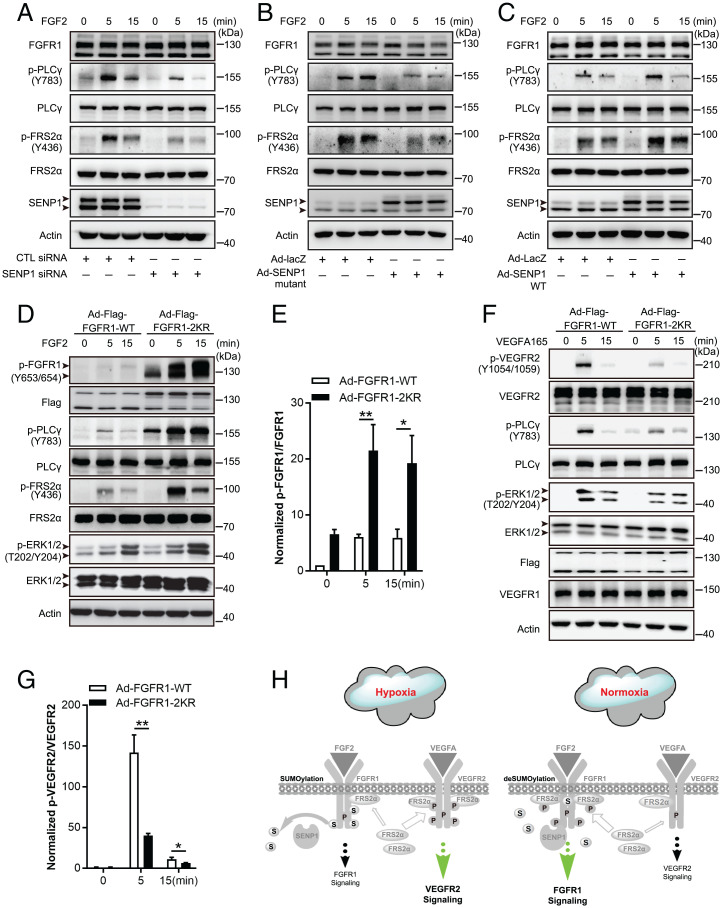
Fig. 4.
SENP1-regulated FGFR1 SUMOylation/deSUMOylation maintains the balance between FGF2/FGFR1 signaling and VEGFA/VEGFR2 signaling in ECs. (A–C) Representative blots showing FGF/FGFR1 signaling in samples in HMVECs with SENP1 knockdown (A), inactive SENP1-mutant overexpression (B), and SENP1-WT overexpression (C). Arrowhead indicates band of interest. (D and E) FGF2/FGFR1 signaling in HMVECs infected with Ad-FGFR1-WT or Ad-FGFR1-2KR after FGF2 stimulation at the indicated time points. Representative blots are shown in D with quantification in E. Arrowhead indicates band of interest. The normalized value of p-FGFR1/FGFR1 is presented as mean ± SEM from three independent experiments. *P ≤ 0.05; **P ≤ 0.01. (F and G) VEGFA/VEGFR2 signaling in HMVECs infected with Ad-FGFR1-WT or Ad-FGFR1-2KR after VEGFA stimulation at the indicated time points. Representative blots are shown in F with quantification in G. Arrowhead indicates band of interest. The normalized value of p-VEGFR2/VEGFR2 is presented as mean ± SEM from three independent experiments. **P ≤ 0.01. (H) Model for SENP1-regulated FGFR1 SUMOylation/deSUMOylation maintains the balance between FGF2/FGFR1 signaling and VEGFA/VEGFR2 signaling in ECs; the consequent mechanism following SENP1-regulated FGFR1 SUMOylation restrains additional association of FGFR1/FRS2α but facilitates VEGFR2/FRS2α complex formation in ECs under hypoxia (gray part, the same procedures as shown in Fig. 3I).  : FRS2α;
  : PTPRG;
  : Phosphate;
  : SUMO1;
  : SENP1;
  : enhanced signaling;
  : restrained signaling. CTL, control.

