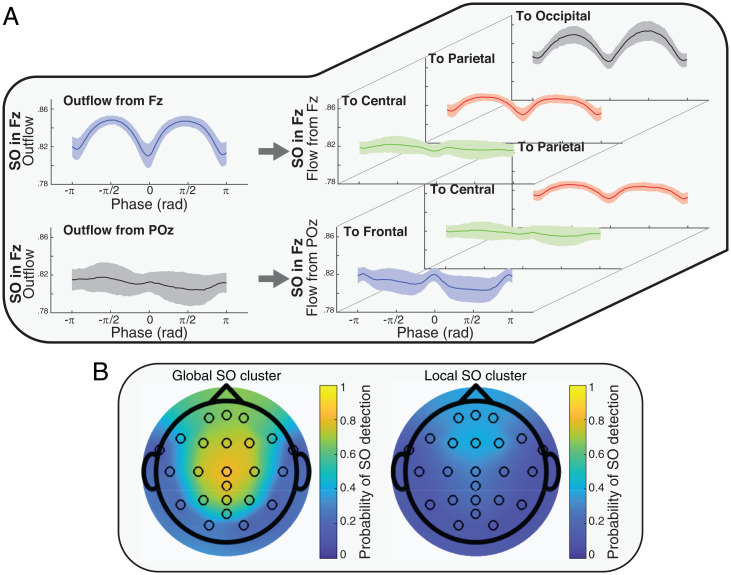
Fig. 2.
Examples of outflow and flow quantifiers and probability of the detected SOs in Global and Local clusters. (A) Examples of information flow from source to sink ( quantifier). The Left plots show the total outflow from the specified source and with the presence of an SO in the specified channel (samples from Fig. 1B). The Right plots represent the portions of the flow from the source to the different sinks. For example, the Top Left plot shows the outflow from Fz as the source when SOs were in the Fz channel, and the three Top Right plots represent portions of that flow at sink. By considering the topology of the SO channels, sources, and sinks, the results suggest a relation between the distance of sink to SO channel and the peaks of information flow. (B) Global and Local SOs derived by the clustering method (Cluster 1: Global SOs, Cluster 2: Local SOs). The colors represent the density of the SOs in each channel.

