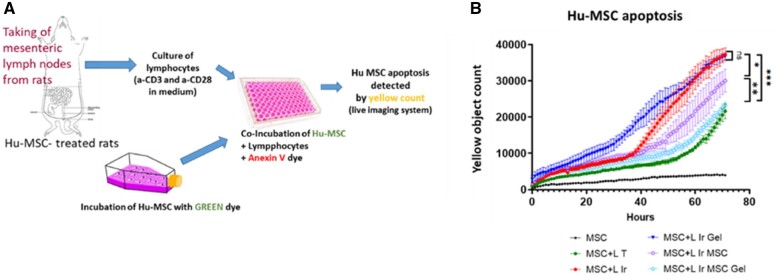
Figure 2.
(A) Schematic diagram of the procedure used to detect cytotoxic activity against injected hu-MSCs in lymphocytes from the different groups of rats using specific dyes and a live cell imaging system. (B) Curves representing the number of apoptotic Hu-MSCs induced after co-incubation with lymphocytes from lymph nodes of the different groups of rats over time. LT = lymphocytes from control rats (n = 12 animals per group); L Ir = lymphocytes from irradiated rats (n = 7); L Ir gel = lymphocytes from irradiated rats injected with Si-HPMC (n = 8); L Ir MSC = lymphocytes from irradiated and hu-MSC-injected rats (n = 14); L Ir MSCGel = lymphocytes from irradiated and Si-HPMC embedded hu-MSC-injected rats (n = 12). Statistics: *P = 0.05; **P < 0.05; ***P = 0.005.

