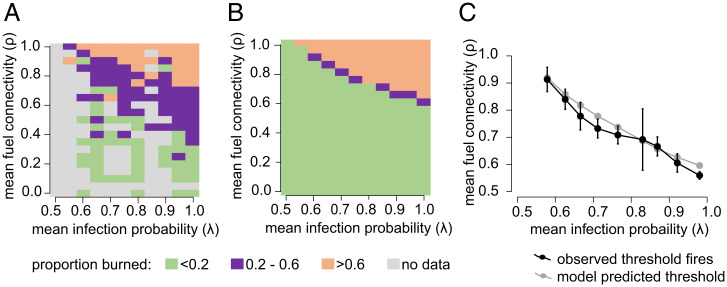
Fig. 2.
Variation in burned area (proportion burned) with fuel connectivity (ρ) and infection probability (λ) in observed fires in Kruger (A) and according to model simulations (B). The response of the fire spread threshold to fuel connectivity (ρ) and infection probability (λ) is also explored in theory and in observed fires in Kruger through examination of “threshold fires” (those with burned area between 0.2 and 0.6, shown in purple in A and B). (C) The mean (± SE, minimum, maximum) values of fuel connectivity (ρ) and infection probability (λ) for all “threshold fires” was 0.72 (±0.04, 0.56, 0.91) and 0.77 (±0.05, 0.58, 0.98), respectively.

