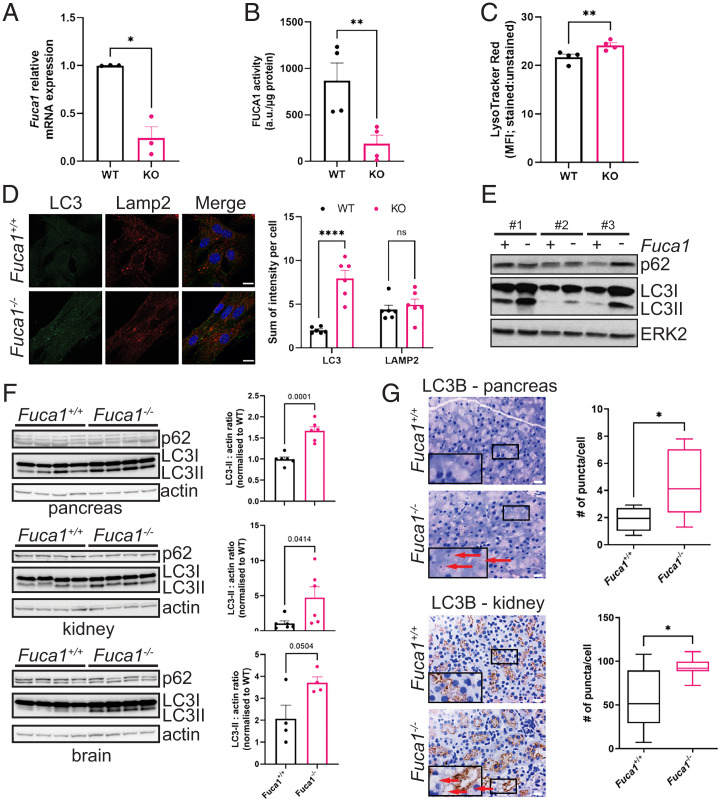
Fig. 2.
FUCA1 loss modulates autophagy both in vitro and in vivo. (A) Primary Fuca1flox/flox MEFs were infected with a retrovirus expressing the Cre recombinase (KO) or a retrovirus control empty vector (WT). Fuca1 relative mRNA expression was determined by qRT-PCR and expressed as the mean of three independent experiments ± SEM (two-tailed paired t test *P = 0.0238). (B) FUCA1 activity was measured and expressed as the mean of three independent experiments ± SEM (two-tailed paired t test **P = 0.0073). (C) LysoTracker red staining was analyzed by flow cytometry and expressed as the mean fluorescence intensity (MFI) ratio of stained versus unstained samples (four independent experiments ± SEM; two-tailed paired t test **P = 0.0046). (D) Fuca1flox/flox CTRL (WT) and Fuca1flox/flox CRE (KO) MEFs were analyzed by immunofluorescence using antibodies directed against LC3B and Lamp2. Nuclei were stained with DAPI. Staining was quantified from six different pictures and expressed as the sum of intensity per cell ± SEM (two-way ANOVA, Sidak’s multiple comparison test: LC3 ****P < 0.0001; LAMP2 n.s.). (Scale bar, 20 µm.) (E) Primary Fuca1flox/flox MEFs isolated from three different embryos were infected with a Cre recombinase retrovirus (Fuca1-) or a retrovirus control empty vector (Fuca1+). LC3B and p62 expression were assessed by immunoblot. Total ERK was used as a loading control. (F) Pancreas, kidney, and brain samples from Fuca1+/+ and Fuca1−/− mice were lysed, and LC3B and p62 analyzed by immunoblot. Representative immunoblot obtained from four mice per genotype is shown. Actin was used as a loading control. LC3II : actin ratio was quantified by densitometry using four to six different samples per genotype (two-tailed unpaired t test; pancreas ***P = 0.0001, kidney *P = 0.0414, brain P = 0.0504). (G) LC3B IHC of pancreas and kidney of Fuca1+/+ and Fuca1−/− mice. LC3+ puncta in pictures (red arrows) were quantified for Fuca1+/+ pancreas (n = 6) and kidney (n = 10), and Fuca1−/− pancreas (n = 6) and kidney (n = 9). (Scale bar, 20 µm.) Insets are magnified (2×) crops from the same images to show specific staining. Box plots represent the quantification of LC3 puncta per cell (Mann–Whitney test; pancreas *P = 0.026, kidney *P = 0.0124).

