Fig. 4.
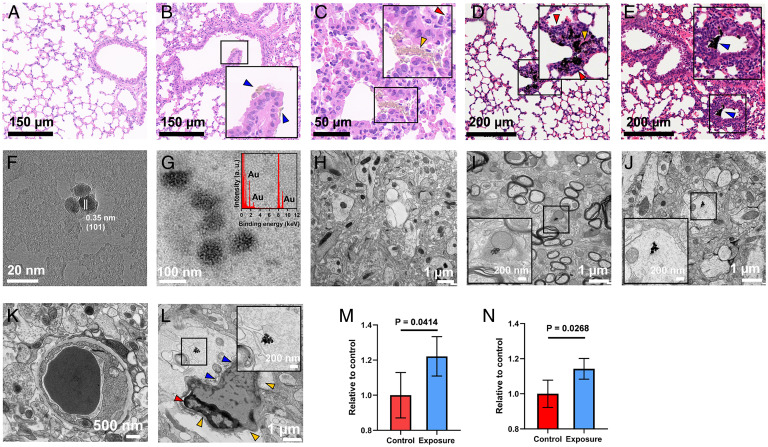
Characterization of the uptake pathway of exogenous fine particles and particle accumulation in tissues using a mouse model. (A–E) Hematoxylin and eosin staining of the lung tissues from the untreated control group (A), the TiO2 exposure group (B and C), and the CB exposure group (D and E), with Insets showing enlarged views of the particle aggregates in the lung sections. The particle aggregates are denoted by blue arrowheads in the alveoli, infiltrated inflammatory cells are indicated by red arrowheads, and translocated particles from the alveoli into septa and capillaries are indicated by yellow arrowheads. The HR-TEM image displays the extracted TiO2 particles (F) and Au-doped CB particles (G, with an Inset showing the EDXS spectrum) from mouse blood following translocation across the air–blood barrier. Compared with the untreated control (H), the HR-TEM images exhibit TiO2 (I) and CB particles (J) in mouse brain tissues, with Insets showing enlarged views of particle aggregates in the brain sections. The ultrastructures of the blood vessels in the control group (K) and the CB exposure group (L, with an Inset showing enlarged view of the particle aggregate near the blood vessel) show different morphologies, as the control group exhibits a thin and uniform basement membrane, but the exposure group manifests structural damage with irregular and defective basal lamina (blue arrowheads), shrinking of endothelial cells (red arrowhead), and deformation of the vessel (yellow arrowheads). The quantification of EB extravasation contents is shown for TiO2 (M) and CB (N) exposure groups (n = 4) relative to the untreated group. Data are presented as mean ± SD.

