Fig. 6.
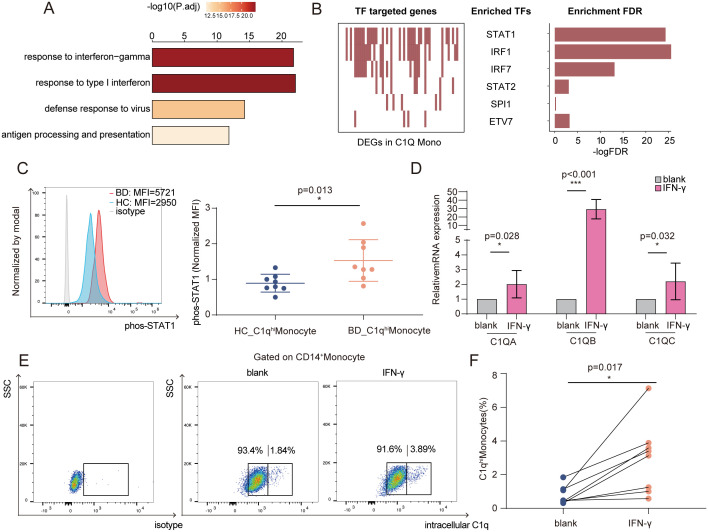
Increased IFN-γ levels led to C1qhi monocyte expansion in BD. (A) Bar plot showing the top four enriched pathways of significantly up-regulated genes in C1qhi monocytes from BD patients. (B) Top TFs predicted as regulators of DEGs (BD versus HC) in C1qhi monocytes by the SCENIC algorithm. Each red rectangle in the left panel represents a gene targeted by the TF. The significant TFs are shown in the middle panel, and the right panel shows the FDR value for the TF calculated by the hypergeometric test for the TF-targeted genes and all other DEGs. (C) Representative histograms (left) and quantification (right) of phosphorylated STAT1 levels (normalized MFI values) in C1qhi monocytes from the BD and HC groups (n = 8 per group). (D) Monocytes were stimulated with IFN-γ for 6 h, and relative mRNA expression (C1q genes) was measured using qRT-PCR (n = 5). (E and F) Representative flow cytometry plot (E) and graph (F) displaying the proportions of C1qhi monocytes after 24 h of IFN-γ stimulation (n = 8). The paired t test (F) and independent-samples t test (C and D) were applied. *P < 0.05; ***P < 0.001. FDR, false discovery rate; P.adj, adjusted P value; SSC, side scatter; phos-STAT1, phosphorylated signal transducer and activator of transcription 1.

