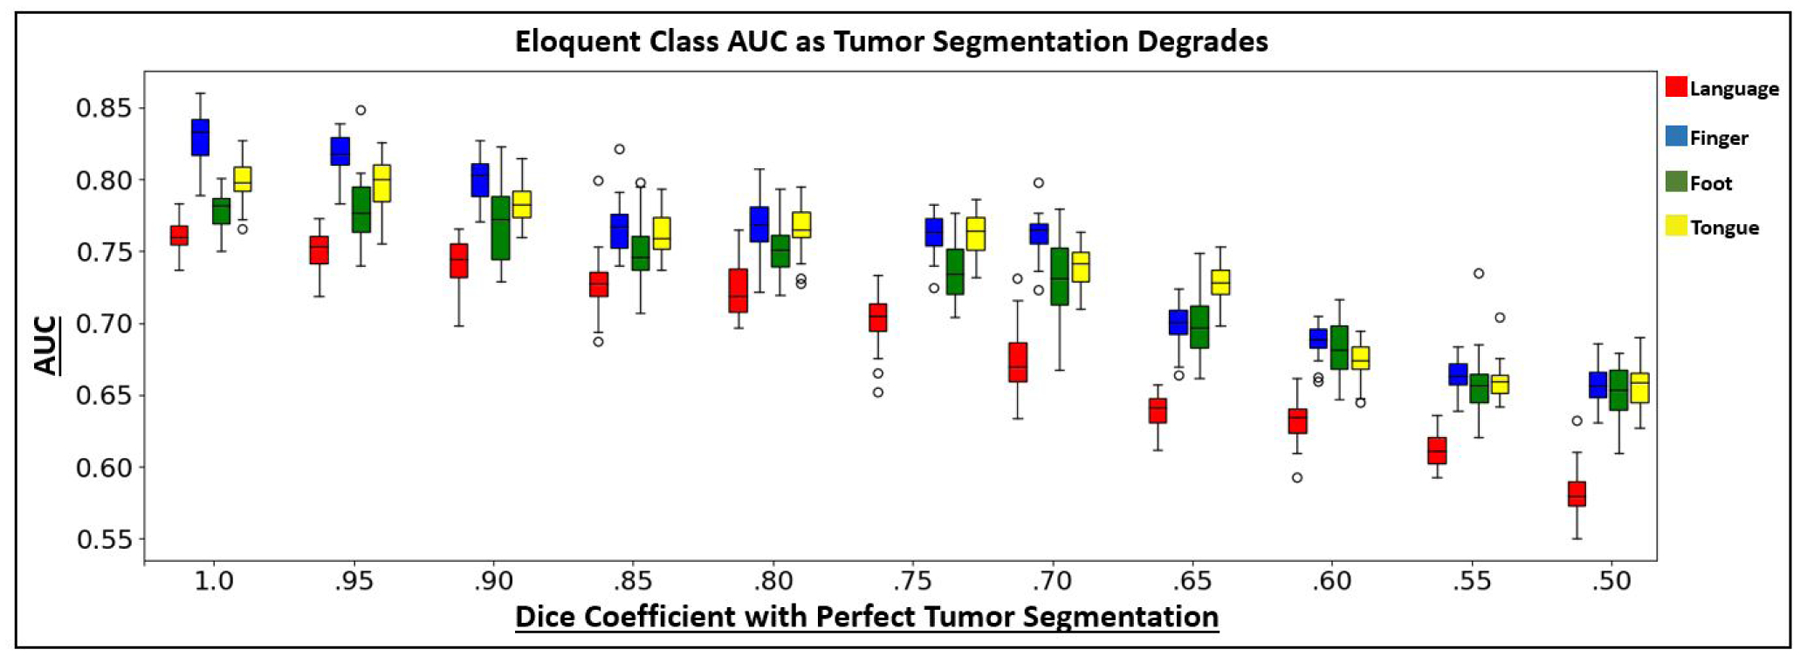
Figure 11:

AUC boxplots using the MT-GNN on the JHH dataset as the tumor segmentations decrease in accuracy. The x-axis shows the dice coefficient of the corrupted tumor segmentation used for evaluation with the manual tumor segmentation. Corruption occurred via a combination of translating, dilating, or shrinking the manual segmentations. The colors red, blue, green and yellow refer to the JHH language, finger, foot and tongue tasks.
