Figure 16:

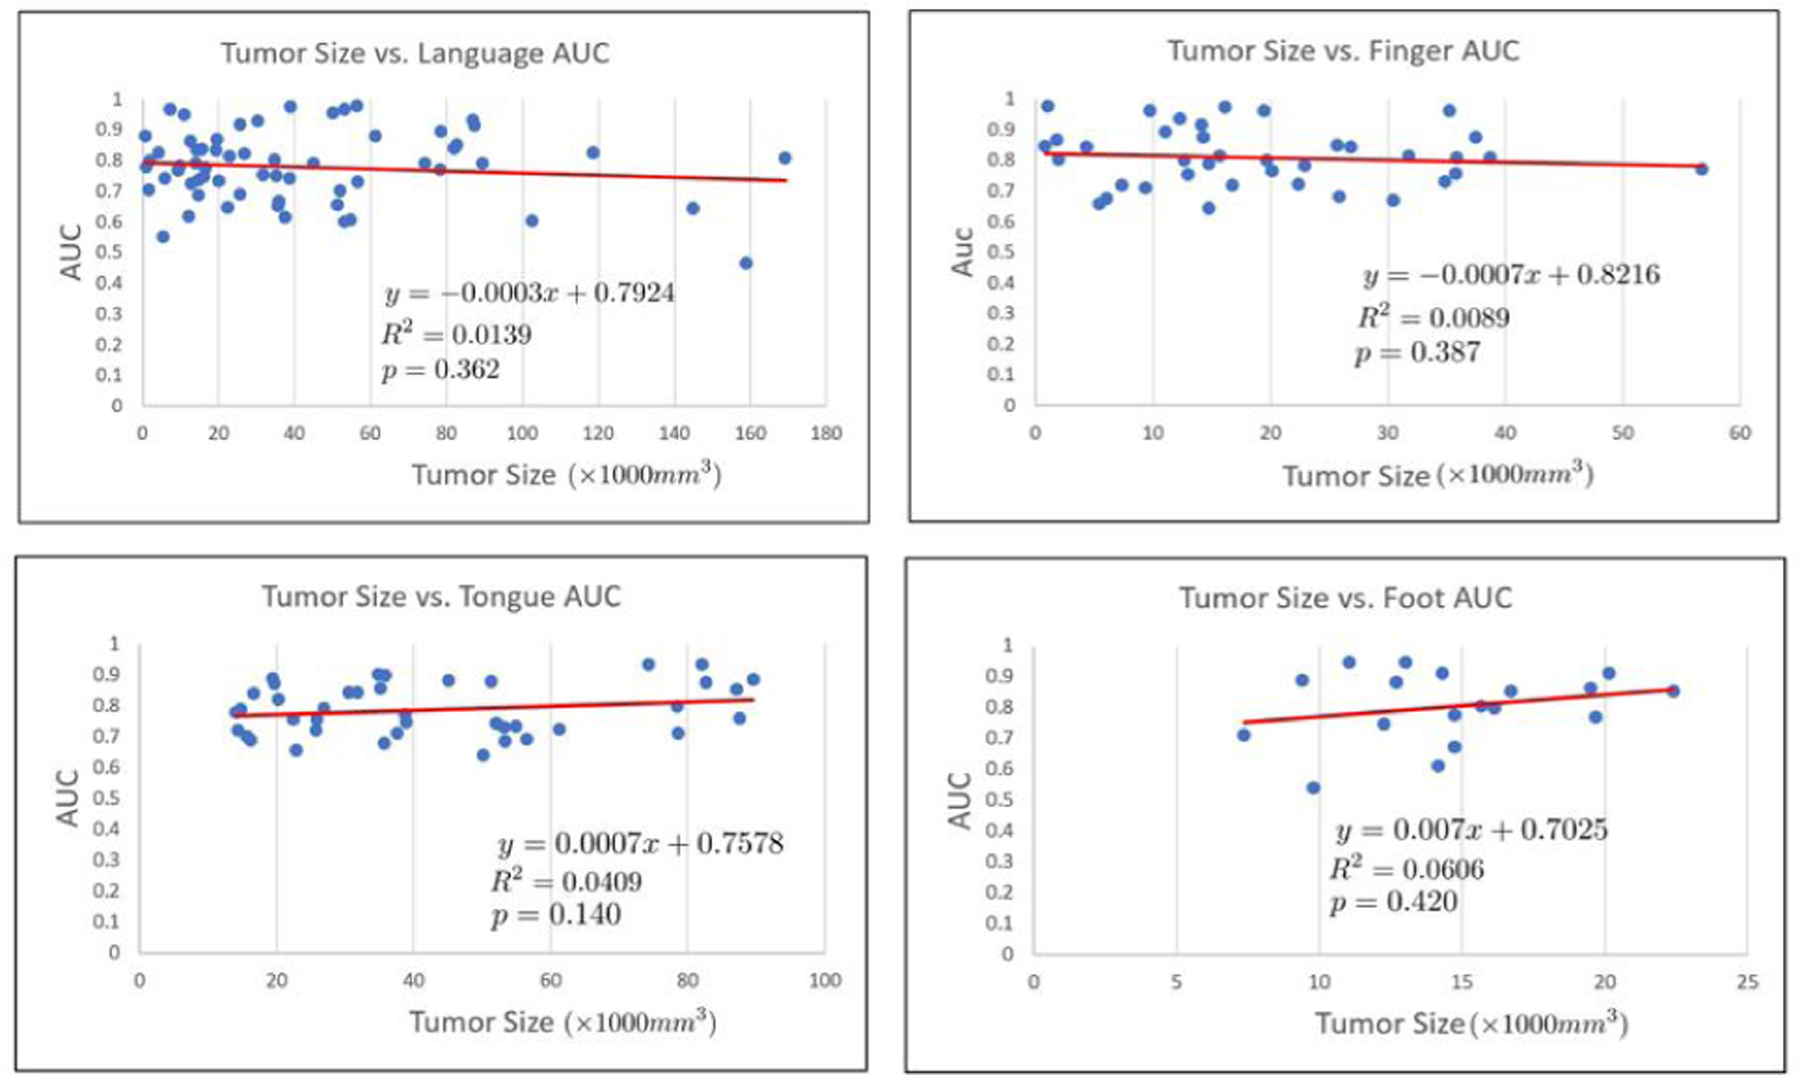
Tumor size vs. AUC for each of the classes of interest. The associated line of best fit equation, R2 value, and p-value are shown. Tumor size is not significantly correlated with any of the four networks.

Tumor size vs. AUC for each of the classes of interest. The associated line of best fit equation, R2 value, and p-value are shown. Tumor size is not significantly correlated with any of the four networks.