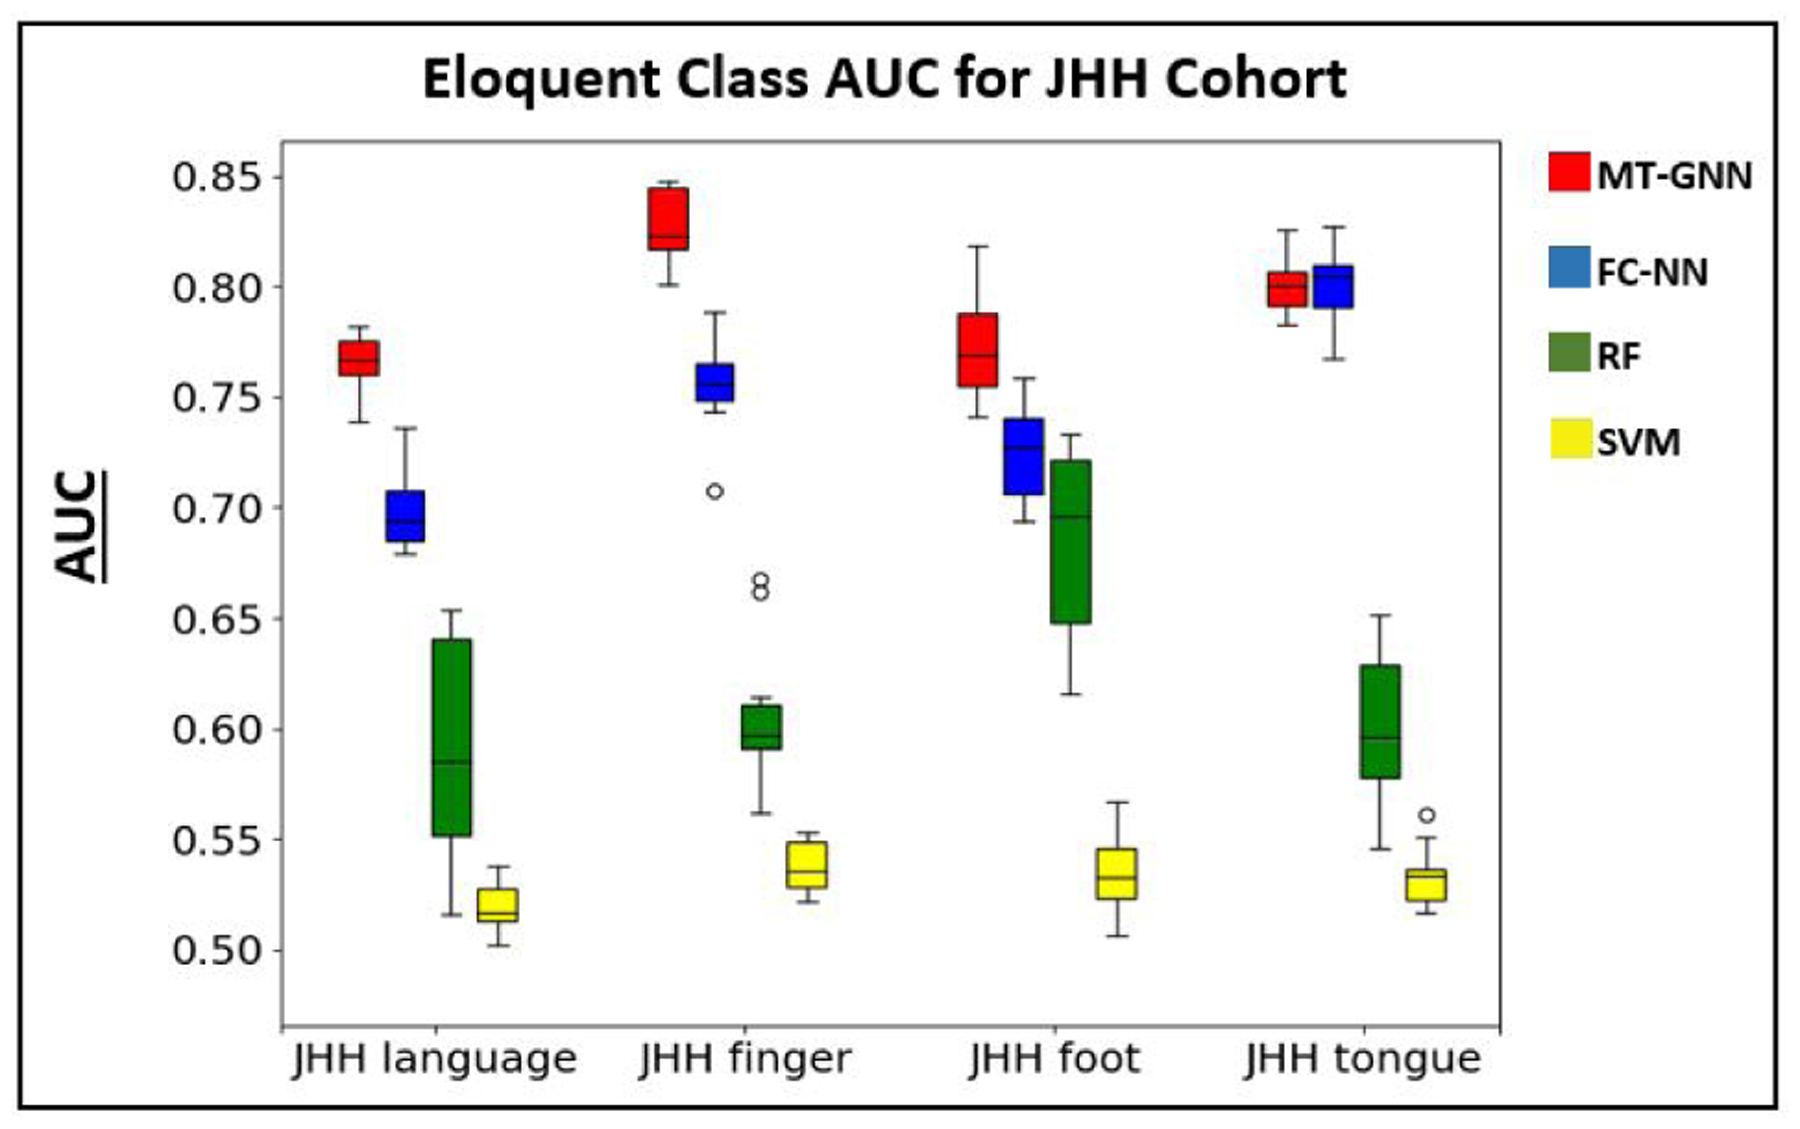
Figure 8:

Boxplot for the AUC metric reported in Table 4. The colors red, blue, green and yellow refer to the MT-GNN, FC-NN, RF, and SVM methods respectively. We observe higher median performance in three out of four tasks and smaller deviations in all four tasks with the MT-GNN.
