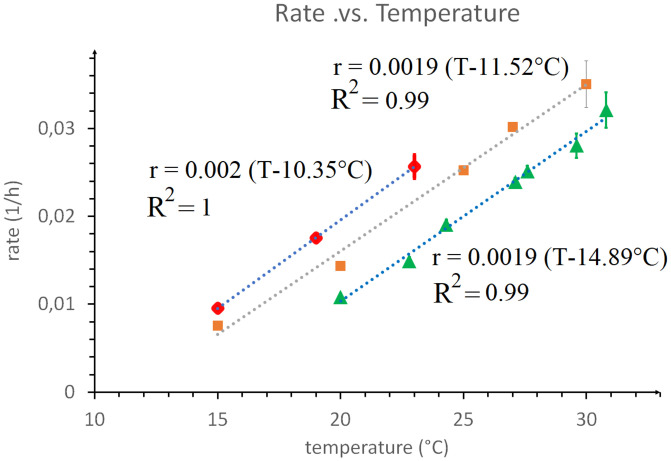
Fig. 1.
The developmental rate r of C. elegans (defined as the inverse of the developmental duration TS) as a function of temperature [red points are data from Filina et al. (2)] and a linear best fit (blue dots). Compare with the developmental rate of the fruit fly (B. carambolae) egg [brown points are data from Danjuma et al. (4)] and linear best fit (gray dots) and with the frequency (divided by 100) of the somitogenetic clock (in hours−1) in zebrafish as a function of temperature [green points are data from Schröter et al. (3)] and linear best fit (blue dots).

