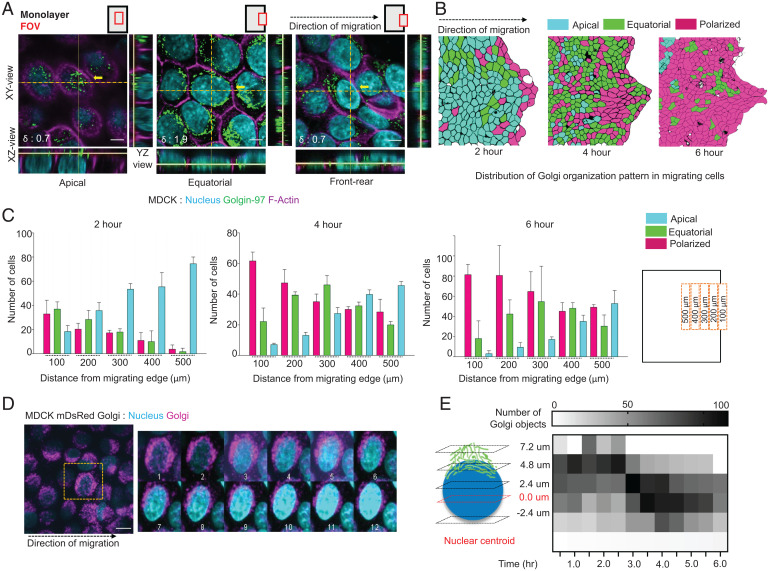
Fig. 1.
A Golgi remodeling process observed during epithelial collective cell migration. (A) Immunostained images of migrating MDCK monolayer displaying the three Golgi organizations. Left to Right, apical Golgi polarity, equatorially dispersed Golgi around the nucleus, and front–rear polarized Golgi. The orthogonal views illustrate the change in Golgi localization with respect to nucleus in the three scenarios. FOV: field of view. Black dotted arrow represents the direction of migration. The δ values for the selected cells (crosshair) shown at the Bottom Left corner. (Scale bar: 5 μm.) (B) Distribution pattern of the Golgi organization types after 2, 4, and 6 h of migration. Black dotted arrow represents the direction of migration. (C) Bar plot displaying the distribution of Golgi organization as a function of distance from the migrating edge after 2, 4, and 6 h of migration. (D) A time-lapse montage (Right) of mDsRed Golgi MDCK cells stained with Hoechst depicting the change in Golgi organization during migration. Images were acquired at 30-min interval for 4 h. The yellow square (Left) shows the cell used in the montage. Black dotted arrow represents the direction of migration. (Scale bar: 5 μm.) (Movie S1). (E) A heatmap showing the change in number of Golgi objects with respect to nuclear centroid with time.

