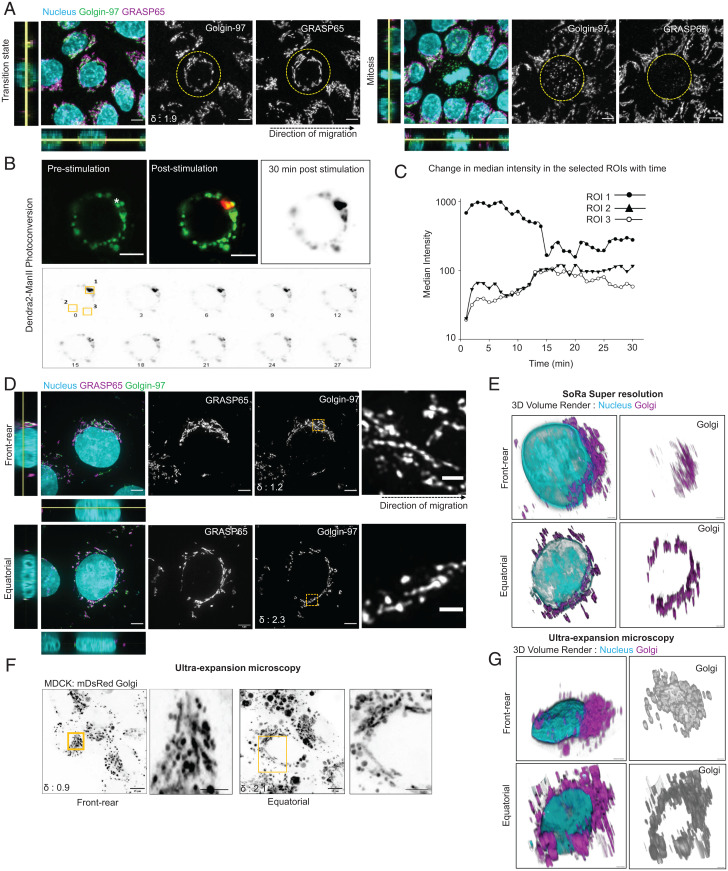
Fig. 2.
Migration induced Golgi remodeling is different from mitotic Golgi remodeling. (A) Fluorescence images comparing the Golgin-97 and GRASP65 organization in a cell with migration induced transition state (Left) and a mitotic cell (Right). Left shows nonfragmented Golgin-97 and ribbon organization of GRASP65. Right displays a fragmented Golgin-97 and significantly diminished signal for GRASP65. Yellow dotted circles mark the cells in focus; the black dotted arrow shows the direction of migration. The δ value for the selected cell shown at the Bottom Left corner in Golgin-97 image, does not apply to mitotic cell. (Scale bar, 5 μm.) (B) Photoconversion of Dendra2-ManII displaying emission upon excitation with 488 nm (for green emission) and 561 nm (for red emission) wavelengths. Prestimulation image shows signal only in the 488 channel; the white asterisk marks the site of stimulation. Poststimulation image shows signals in both 488 and 561 channels. The time-lapse montage (Bottom) of the poststimulation red signal shows the diffusion of the photoconverted signal across Golgi. (Scale bar: 5 μm.) (Movie S3). (C) Scatter line plot of median intensity changes in the selected ROIs. (D) SoRa super-resolution images showing Golgin-97 and GRASP65 organization in polarized (Top) and equatorially dispersed Golgi (Bottom). Zoomed-in area from the yellow box shows Golgi retains ribbon organization in both scenarios. The black dotted arrow shows the direction of migration. The δ values for the cells in focus shown at the Bottom Left corner in Golgin-97 image. (Scale bars: 4 μm, Top; 6 μm, Bottom; 1 μm-zoomed in Insets.) (E) 3D volume render of the SoRa images. (F) Ultra-expansion images of mDsRed Golgi cells with polarized (Left) and equatorially dispersed Golgi (Right). The zoomed-in area in the yellow box shows long ribbons in both the cases. The δ values for the cells in focus shown at the Bottom Left corner. (Scale bar: 15 μm; 5 μm zoomed-in Insets.) (G) 3D volume render of the expansion images.

