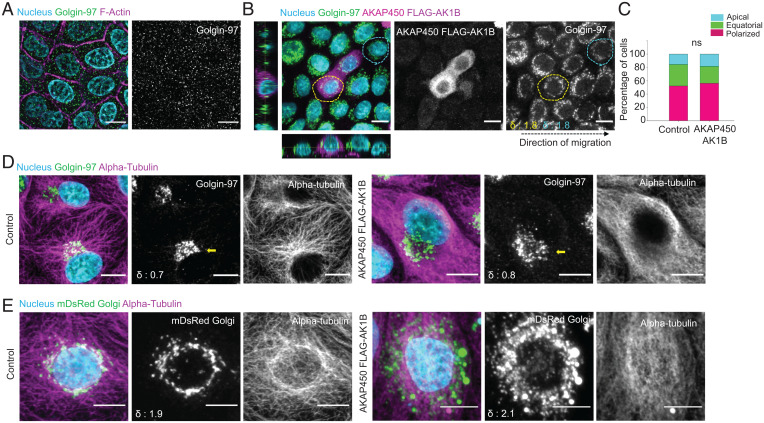
Fig. 3.
Golgi-associated microtubules are dispensable for MIGAR. (A) Immunostained images of nocodazole-treated migrating MDCK monolayer showing a fragmented Golgi dispersed across cytoplasm. (Scale bar: 5 μm.) (B) Fluorescence images of migrating mosaic monolayer of MDCK cells and MDCK-AKAP450-FLAG-AK1B overexpressing cell (yellow dotted area), both control (cyan dotted area) and mutant show equatorial Golgi dispersion. The δ values for the selected cells shown at the Bottom Left corner in Golgin-97 image. (Scale bar: 10 μm.) (C) A Stacked vertical bar plot showing no significant change in percentage of cells with equatorial Golgi in control versus AKAP450-AK1B overexpressing cells. n = 81 cells. (D) Microtubule immunostaining pattern in control MDCK cell and AKAP450-AK1B overexpressing cell. Left shows the microtubules originating from Golgi in control cells. Right shows the AKAP450-AK1B overexpressing cells with a clear hollow for microtubules around Golgi. The δ values for the selected cell (yellow arrow) shown at the Bottom Left corner in Golgin-97 image. (Scale bar: 10 μm.) (E) Immunofluorescence images showing the perinuclear microtubule organization pattern during equatorial Golgi dispersion in control cells (Left), and undiscernible microtubule organization in AKAP450-AK1B overexpressing cells (Right). The δ values shown at the bottom-left corner in mDsRed Golgi image. (Scale bar 5 μm.)

