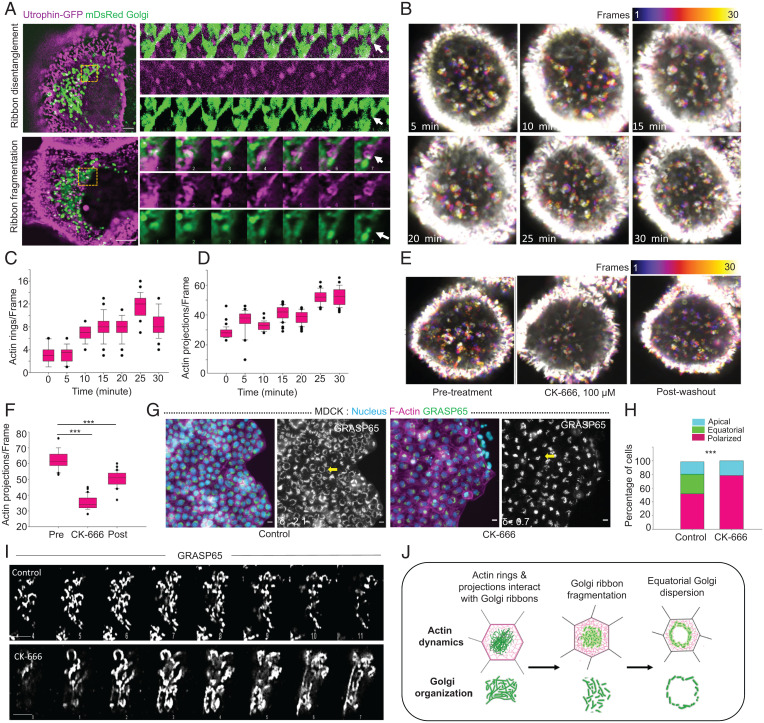
Fig. 4.
Interaction of Actin rings and projections with Golgi is required for controlled ribbon dynamics and organization during MIGAR. (A) Live cell time-lapse images of cells expressing Utrophin GFP and mDsRed Golgi showing actin-Golgi interaction, Top shows ribbon disentanglement following actin projection interaction with Golgi ribbon (Movie S4). Bottom shows ribbon fragmentation following actin ring sliding over the Golgi ribbon (Movie S5). A montage of the boxed areas shows both Golgi and actin dynamics with time, white arrowhead marks the fate of the interaction. Images were taken at 1-s intervals for 1 min. (Scale bar: 2.5 μm.) (B) Temporal color projected images of MDCK cells expressing utrophin GFP following initiation of the migration at 5-min intervals. The number of actin rings and projections increases with time as migration ensues. Color key shows the frame numbers. Image dimension, 16.69 × 16.69 μm. (C and D) Box-and-whiskers plot of the number of actin rings (Left) and projections (Right) depicting gradual increase in the number with migration. n = 30 frames. (E) Temporal color projected images displaying the change in number of actin projections following Arp2/3 inhibition by CK-666 (100 μM) and post drug washout. Color key shows the frame numbers. Image dimension, 25.56 × 25.56 μm. (F) The box-and-whiskers representation showing the change in number of actin projections under conditions of pretreatment, CK-666, and post washout, (P < 0.001). n = 30 frames. (G) Fluorescence images of MDCK monolayer showing normal MIGAR distribution pattern in control cells (Left) and loss of equatorial Golgi dispersion in CK-666-treated sample (Right). The δ values for the selected cell (yellow arrow) shown at the Bottom Left corner in GRASP65 image. (Scale bar: 10 μm.) (H) A stacked vertical bar plot showing the percentage of cells with polarized, equatorial, and apical Golgi in control and CK-666-treated condition (P < 0.001). n = 95 cells. (I) Zoomed in Z-stack of Golgi ribbons showing the difference in Golgi ribbon in control cells (Top) and CK-666-treated cells (Bottom). (Scale bar: 5 μm.) (J) Schematic representing the mechanism of Golgi ribbon fragmentation following interaction with actin.

