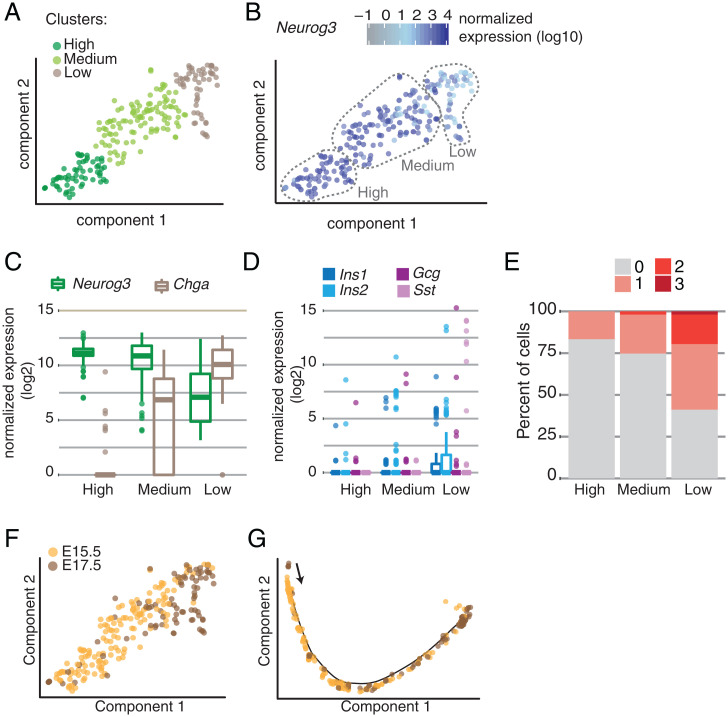
Fig. 2.
(A) t-SNE plot showing Neurog3-expressing cell subsets. Each dot is a single cell, colored by clusters or by (B) Neurog3 expression. (C) Box plots show normalized Neurog3 and Chga expression in each cluster. (D) Box plots show normalized hormone transcripts detected in each cluster. (E) Stacked bar plot showing the percent of cells within each cluster expressing zero, one, two, or three hormone transcripts (Ins1 or Ins2, Gcg, Sst). (F) t-SNE projection of Neurog3-expressing cells colored by the embryonic day they were isolated. (G) Pseudotime trajectory of Neurog3-expressing cells colored by the embryonic day they were isolated.

