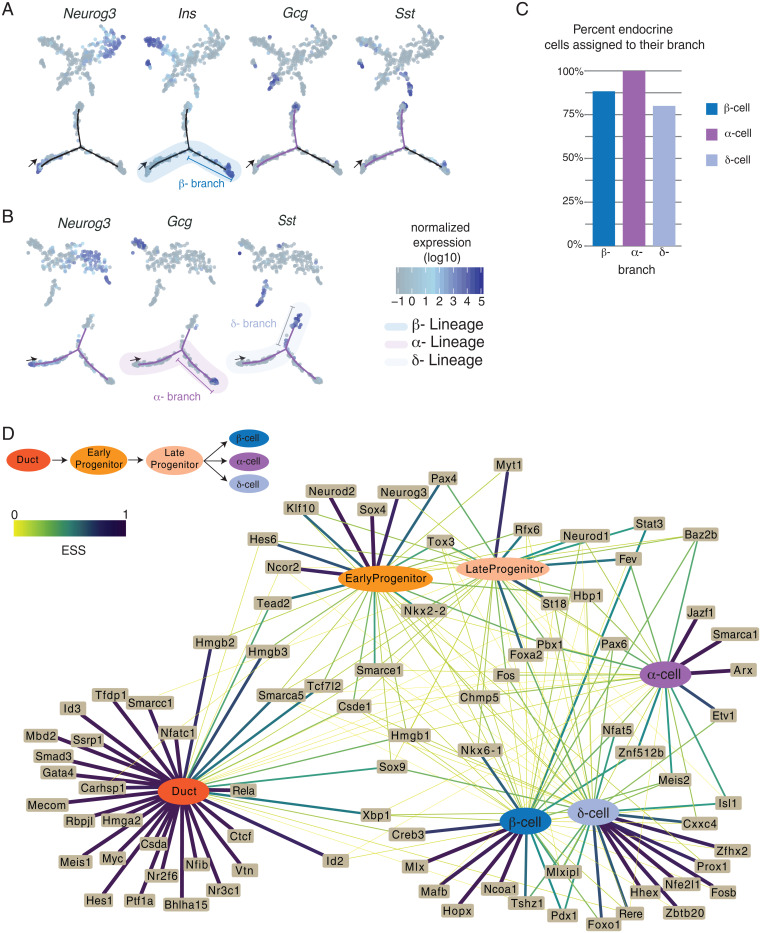
Fig. 3.
(A) (Top) t-SNE plots showing semisupervised clustering of single cells, first iteration to resolve β-lineage. Each dot is a single cell, colored by marker gene expression. (Bottom) Trajectory of cells beginning at the arrow; each dot is a single cell and is colored by marker gene expression. High expression of Ins1 and Ins2 is seen in cells at the end of the β-branch. (B) (Top) t-SNE plots showing semisupervised clustering of single cells, second iteration to resolve the α- and δ-lineages. Each dot is a single cell, colored by marker gene expression. (Bottom) Trajectory of cells beginning at the arrow; each dot is a single cell and is colored by marker gene expression. High expression of Gcg is seen on the α-branch, and Sst is seen in cells at the end of the δ-branch. (C) Bar graph indicating the percent of endocrine cells that were assigned in the appropriate branch: 88% for β-, 100% for α-, and 80% for δ-cells (D) Network showing the relationship between TF expression and cell state. The edges represent the expression specificity of TFs in each state. Thickness and color of the edges directly correspond to the expression specificity scores (ESSs) (SI Appendix, Methods). ESS values range from 0 to 1, where ESS = 1 means TF is exclusively expressed in that cell type, and ESS = 0 means no expression. Ubiquitous expression is ESS = 0.166.

