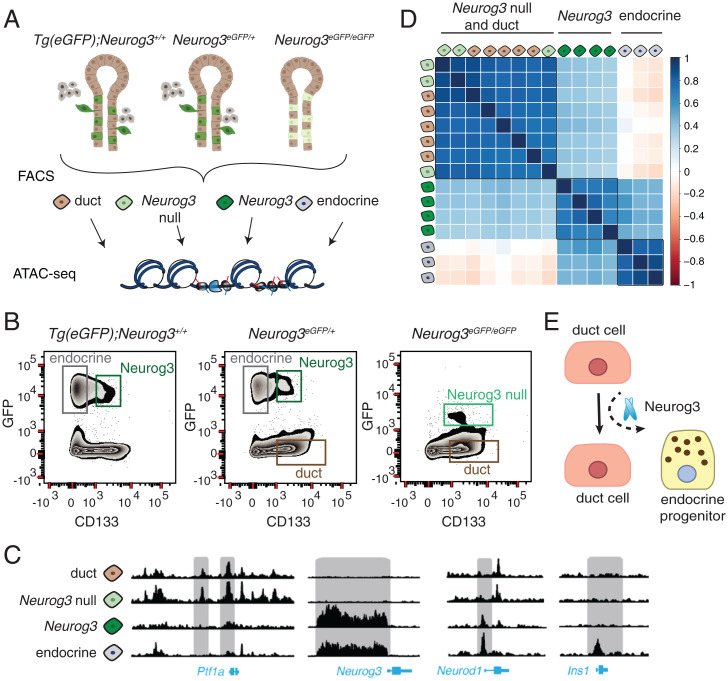
Fig. 4.
(A) ATAC-seq workflow used in this study. (B) Representative FACS plots showing sorted cell populations and gating strategy. Three mouse genotypes were used to collect four types of cell populations from E15.5 embryos. (C) ATAC-seq reads obtained from different cell populations visualized on the genome browser near the gene loci: Ptf1a, Neurog3, Neurod1, Ins1. (D) Pearson’s correlation matrix showing the similarity of ATAC-seq samples. A value of 1 indicates high correlation, 0 indicates no correlation, and −1 indicates anticorrelation. The samples are colored as in A. (E) A parsimonious model for endocrine pancreas differentiation, where Neurog3 functions as a pioneer factor to shift cells from the default ductal lineage to the endocrine lineage.

