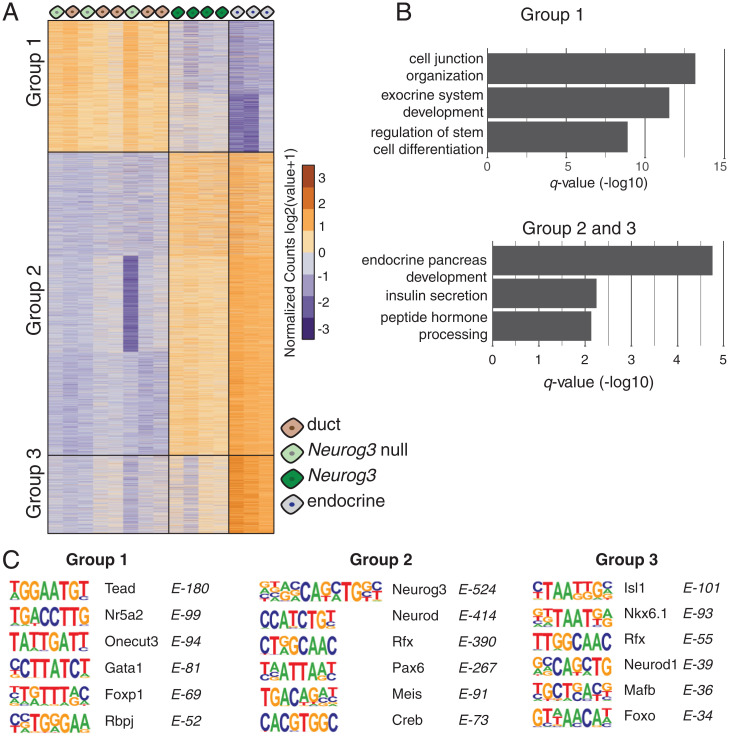
Fig. 5.
(A) Heat map showing differentially open chromatin regions. Each column is an ATAC-seq sample, and each row is an open chromatin region, organized by k-means clustering. Three groups of open regions were identified and indicated on the graph. (B) Bar graphs show significant GO terms associated with open regions identified in A. (C) Position weight matrices of enriched TF motifs found in each of the three open chromatin groups.

