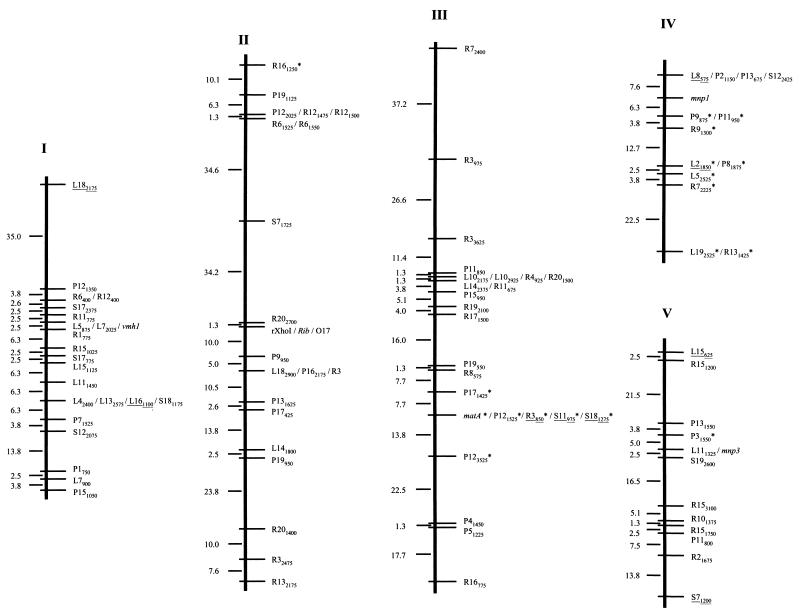
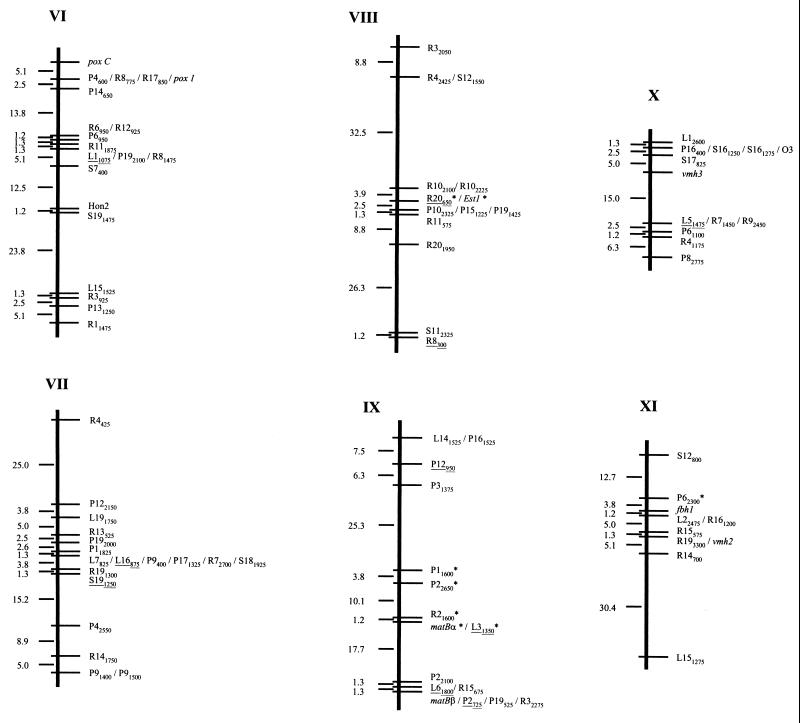
FIG. 2.
Linkage map of P. ostreatus. Linkage groups are numbered in accordance with the molecular size of the corresponding chromosome (in protoclone PC9) revealed by PFGE (32). Polymorphic RAPD markers were named by the primer designation, followed by the approximate size of the amplified fragment in base pairs. RAPD markers converted into RFLP markers are underlined. Genes are in italics. Markers that deviated from the expected 1:1 segregation (P < 0.05) appear with an asterisk to the right of the marker name. The linkage distances (centimorgans) between consecutive genetic markers are indicated on the left of each linkage group.


