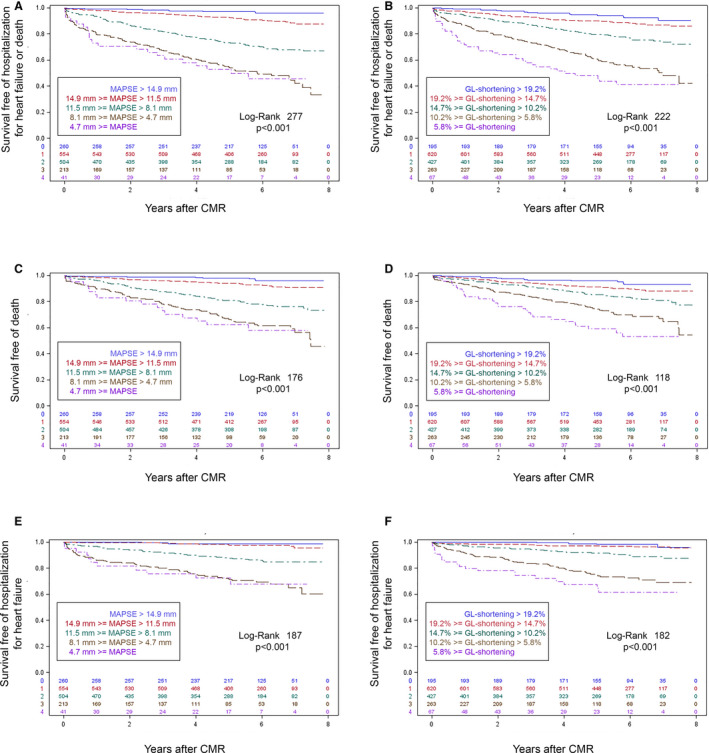
Figure 5. Kaplan‐Meier survival curves for artificial intelligence (AI)‐measured global longitudinal shortening (GL‐Shortening) and mitral annular plane systolic excursion (MAPSE) for the outcome data set.

Based on the log‐rank statistic, MAPSE (A, C, and E) associated more strongly with outcomes of the composite of hospitalization for heart failure (HHF) or death (top row, n=335), death only (middle row, n=250), and HHF in survivors (bottom row, n=147) than the GL‐Shortening (B, D, and F) among participants (n=1572). To illustrate dose‐response relationships in both MAPSE and GL‐Shortening, Kaplan‐Meier curves relative to the median, standard deviation increments separated the strata, with the top 2 strata above the median and the lower 3 strata below the median (given the skewed distributions visible on histograms). CMR indicates cardiac magnetic resonance.
