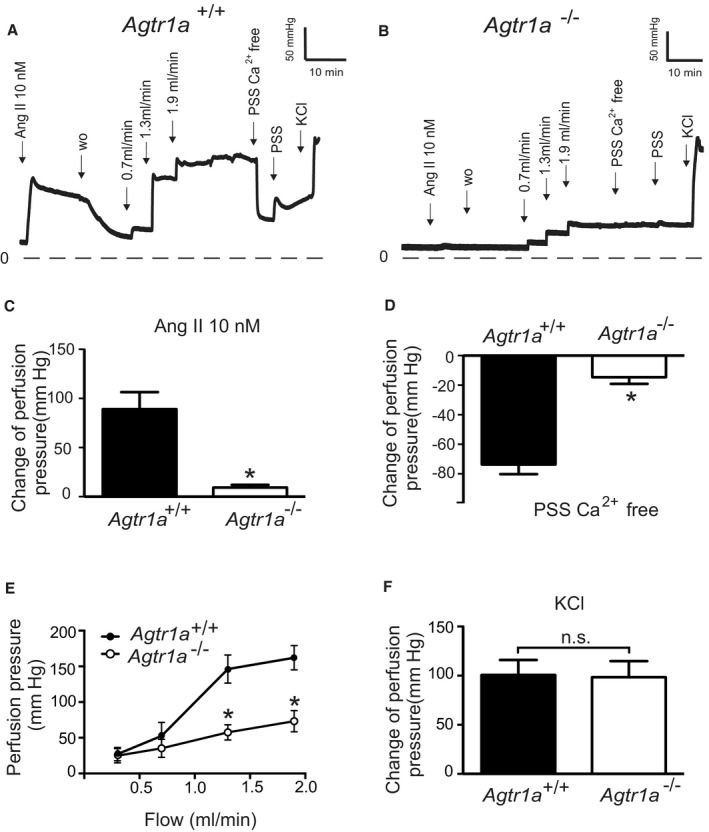
Figure 1. Vasoregulation in isolated perfused kidneys of Agtr1a −/− mice.

A and B, Original recordings of perfusion pressure in kidneys of Agtr1a +/+ (A) and Agtr1a −/− mice (B). C, Increase in the perfusion pressure induced by 10 nmol/L Ang II. D, Myogenic tone assessed by exposure to Ca2+ free PSS. E, Perfusion pressure at flow rates of 0.3, 0.7, 1.3, and 1.9 mL/min. F, Increase in the perfusion pressure induced by 60 mmol/L KCl. n=6 Agtr1a +/+ kidneys from 6 mice and n=7 Agtr1a −/− kidneys from 7 mice for all panels. *P<0.05. Ang II indicates angiotensin II; n.s., not significant; PSS, physiological saline solution; and wo, wash‐out.
