
FIGURE 4.
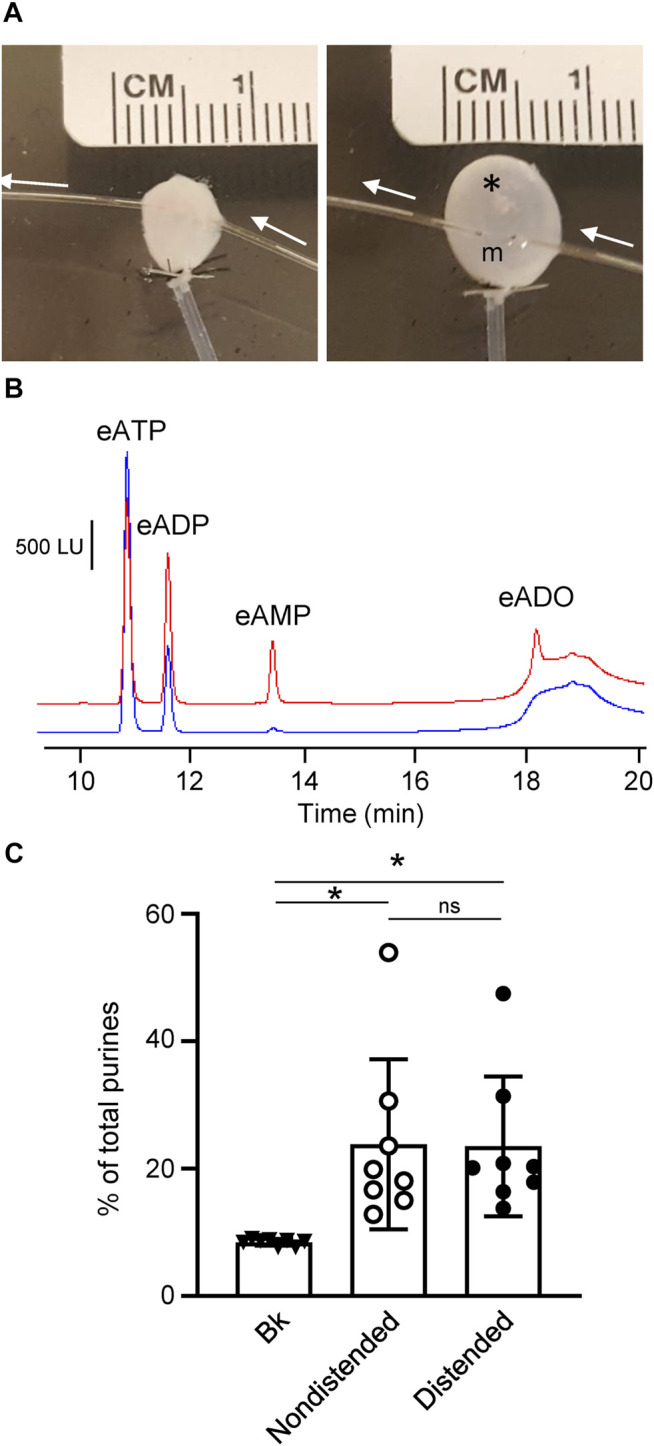
Degradation of eATP in the suburothelium evaluated by microdialysis of the bladder wall. (A) Microdialysis probe implanted between suburothelium/LP and detrusor muscle of nondistended (left panel) and distended (right panel) mouse urinary bladder. m, microdialysis membrane outlined with black dots; white arrows show the direction of microdialysis perfusion. *, air bubbles inserted in bladder to show transparency of the wall. (B) Original chromatograms of eATP substrate in absence of tissue (beaker and blue) and in dialysate from nondistended bladder (red). Addition of eATP in the solution perfusing the microdialysis probe resulted in an eADP increase and the appearance of eAMP and eADO. (C) Summarized data showing formation of product (eADP + eAMP + eADO) from eATP after microdialysis of nondistended and distended bladder preparations with eATP. Data are presented as percentages of total purines (eATP + eADP + eAMP + eADO) present in dialysate. *P < 0.05, ns, non-significant difference.