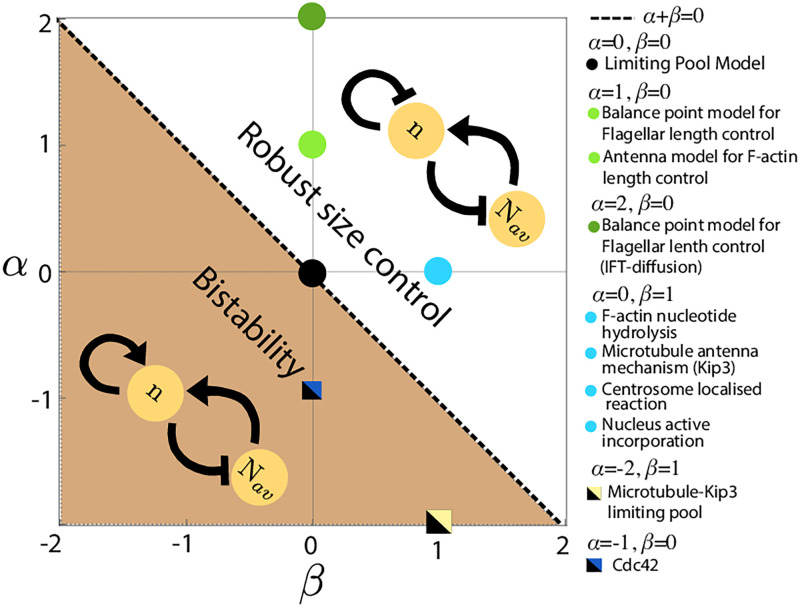
Fig 2. Phase diagram of the size-dependent growth model.
Phase diagram of the size-dependent growth model in α-β plane, showing the different regimes of size control. α + β > 0 defines the regime of negative autoregulation of growth which guarantees robust size control. Positive autoregulation of growth (α + β < 0) gives rise to bistable size distribution. The phase boundary α + β = 0 corresponds to a class of models where there is no size regulation of individual structures, similar to the limiting pool model (α = 0, β = 0). We map our model to size control mechanisms for a variety of intracellular structures, from linear filaments to organelles.

