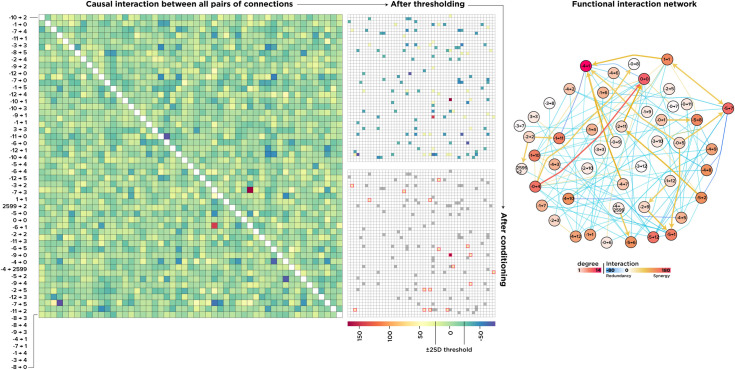
Fig 7. Pairwise interactions among all connections.
An interaction matrix resulting from the PCIA procedure in which warmer colors show greater synergy and cooler colors indicate functional overlap (left). We excluded the values within a range of ±2 SD above and beyond the mean and applied the “Sprague effect” condition to the thresholded matrix (middle). On the right-hand side, we plotted the interaction network in which the nodes represent connections in the actual network, and the edges are interactions among them. Arrows show paradoxical-lesion effects (i → j).

