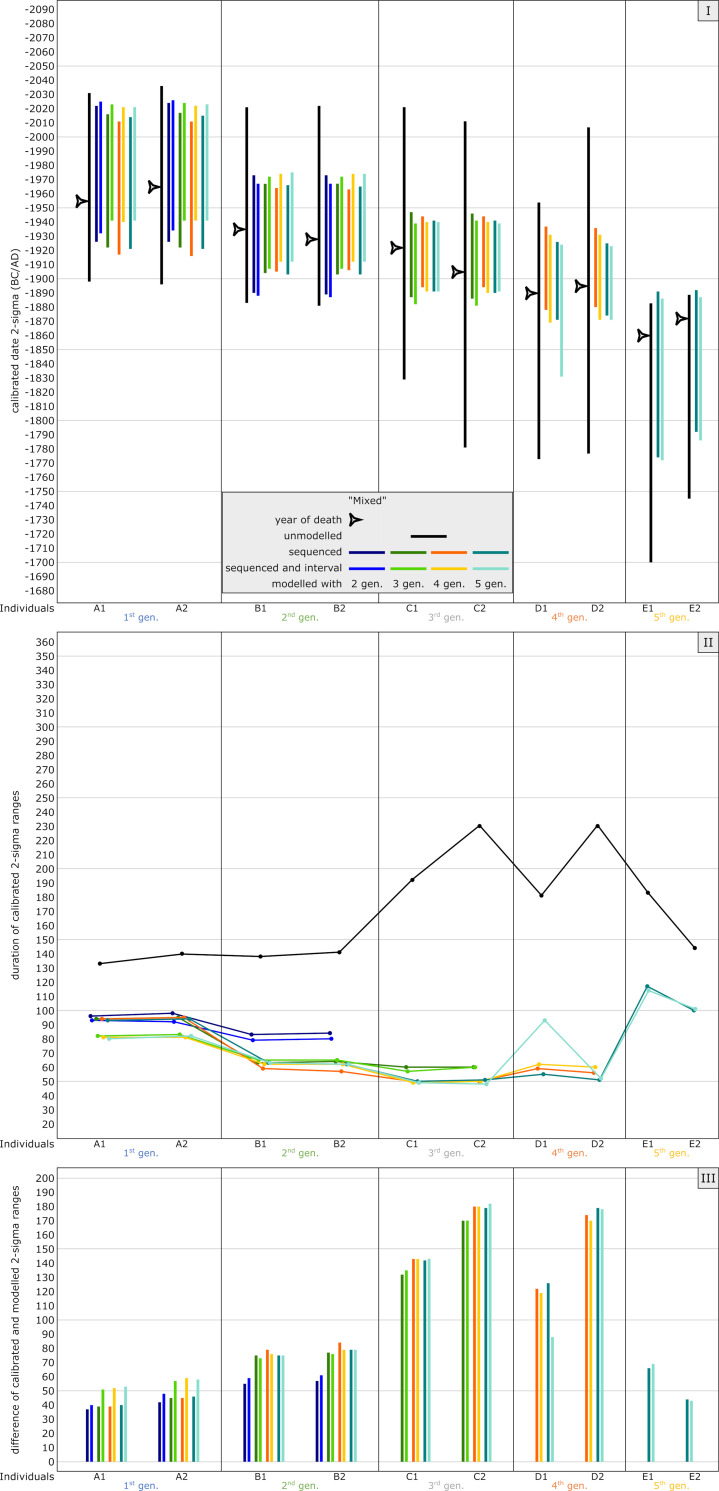
Fig 14. Graphic representation of the results of the simulated mixed model.
Unmodelled, calibrated dates (black bars) plotted against modelled ranges of simulation runs with 2 (dark blue), 3 (green), 4 (orange) and 5 (light blue) generations incorporated into the models. The darker colour shade presents a pure sequencing model of each run, with the lighter colour shade indicating sequenced models and with defined intervals between the generations. Triangle symbols depict the actual YoD’s as inserted at the outset of the modelling process. (I) Dating ranges and YoD’s according to their calendric years. (II) Duration of calibrated unmodelled and modelled dates. (III) Calibrated range differences between unmodelled and modelled dates. For results and parameters of the simulation, cf. Fig 5, S3 Table and S3 Codes.

