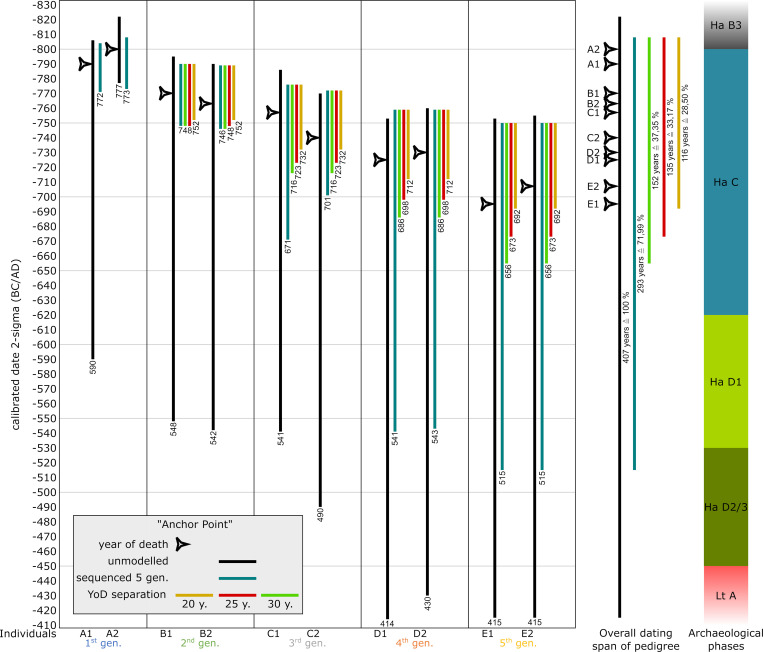
Fig 18. Combining pedigree-based Bayesian modelling and additional constraints.
Unmodelled, calibrated date ranges (black) plotted against modelled ranges of simulation runs with 5 generations (blue) of the anchor point simulation. Additional constraints are results of varying YoD separations between individuals from subsequent generations (yellow: 20 years, red: 25 years and green: 30 years). Numbers below vertical bars are endpoints of dating ranges. Triangle symbols depict the actual YoD’s as inserted at the outset of the modelling process. The archaeological phases are based on the relative chronology of southern Germany.

