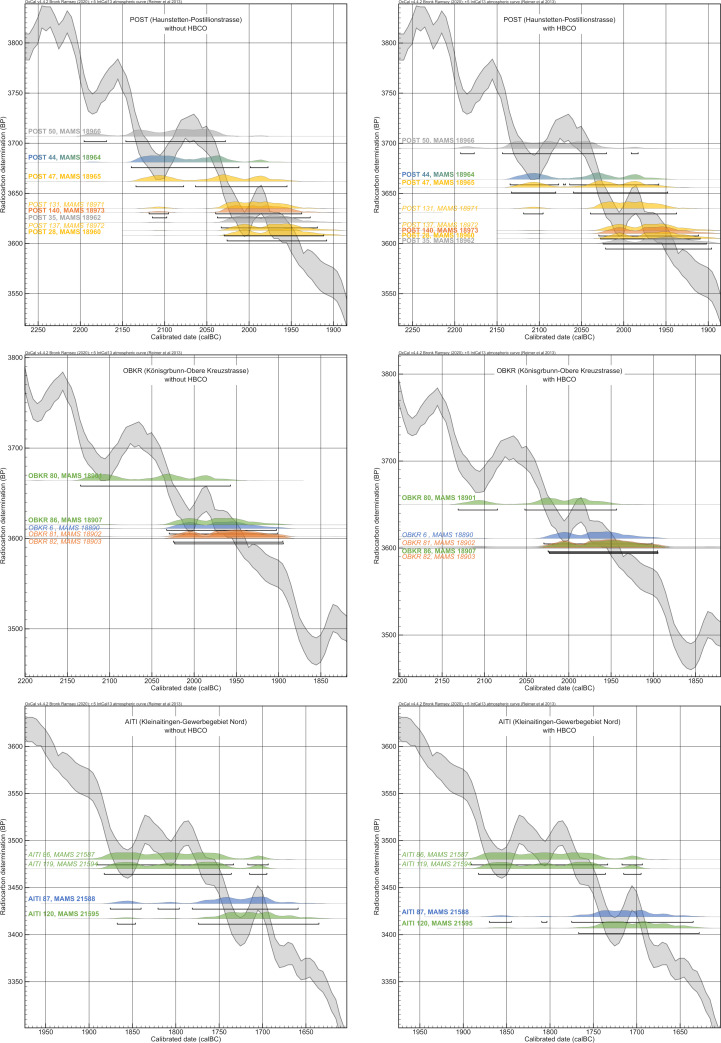
Fig 19. Comparison of radiocarbon dates without and with HBCO correction.
Calibrated radiocarbon dates of individuals from the pedigrees plotted onto the calibration curve with 2-sigma probabilities and coloured according to their generation level. Left side: results of the radiocarbon measurements; right side: radiocarbon dates with HBCO correction. POST_44 is coloured with a blue to green fade because of its unclear assignment to either the 1st or 2nd generation (for results and parameters of the measurements and employed HBCO corrections according to Barta/Štolc 2007 [31], see. Table 1).

